Should You Care About Worker Happiness?

data point tuesday_500

Universum has just published another fascinating survey analysis that should be required reading for any leader wondering about the engagement of their employees, humanity in the workplace, or whether or not their workforce is happy. The summary is available here and it introduces the Universum Global Workforce Happiness Index™.

The survey covered 250,000+ professionals in 55 markets in order to set country- and industry-level benchmarks. The Universum Global Workforce Happiness Index is calculated based on:

  1. Employee satisfaction in their current job,

  2. Likelihood of recommending their current employer, and

  3. Their stated sense of job loyalty.

Starting off with a simple four-box model of work happiness, the four quadrants are simple to understand because of their common sense approach:

Universum Happiness 1STRANDED employees feel dissatisfied in their current jobs, but are unmotivated or unwilling to make a change. SEEKERS are dissatisfied at work and looking for a change. RESTLESS employees require immediate attention because even though they are satisfied and likely to recommend their employee, they are open to changing jobs. FULFILLED employees are satisfied, feel positive about their employer as a place to work and aren’t interested in changing jobs. This construct is simple and makes it easy to relate to these four types of workers.

If you are leading a global business, then the Global Workforce Happiness Index By Country chart will give you some interesting data to chew on:

Universum Happiness 2
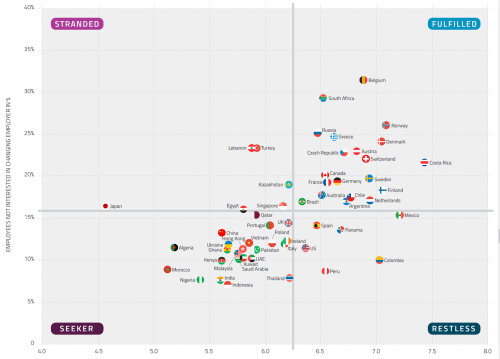
If you have global expansion plans should you prioritize those countries whose workers are Restless? Or countries whose workers are Seekers? Or do you go right for the Fulfilled worker countries? Maybe it isn’t enough to be looking at skills availability – maybe the availability of hearts and minds should also be a factor.

This report summary packs a great deal of insight into just 17 pages and I’ve just skimmed the surface for you. In the final section, every employer would do well to follow this recommendation: separate “attraction drivers” from “retention drivers.” Do the characteristics that attract high quality candidates to your organization retain them for the medium- or long-term? For organizations battling it out in the talent wars around the globe, this is the next tough question to answer.

The implications of workforce happiness around the world – especially with GenY and GenZ becoming the dominant generations at work – are beginning to change how every organization relates to its people. We’re re-thinking lots of fundamental people processes, policies and behaviors. Factoring the happiness of our people is just one of the ways things are changing.

This is a super report. It gives just enough analysis to be useful, while creating the case to get the full report. I liked it a lot.

2 Comments

Filed under Analytics, China Gorman, Data Point Tuesday, Employee Engagement, Global Workforce Happiness Index, Happiness at Work, HR Data, Universum

Sometimes it IS about the methodology!

data point tuesday_500

There’s no denying that Linkedin is a 600 pound gorilla in the talent acquisition space. But as I write that, I wonder in what space exactly Linkedin is. Wikipedia says Linkedin is a business-oriented social networking service. Linkedin says it’s the world’s largest professional network with 380 milllion members. Is it the ultimate job board? Is it an employer branding consulting firm? Is it a talent research firm? Is it a recruiting company? Maybe it’s all those things. Maybe it’s none of those things and it’s something else altogether. But whatever it is, I think we’d all agree that it’s big, it seems to be influential, lots of companies in the talent space are afraid of it, and most professionals – all over the world – wouldn’t look for a job without it.

So I read with interest Linkedin’s new report, Global Recruiting Trends 2016. It’s a quick read with some interesting data. The report sections are:

  • Introduction

  • Key takeaways

  • Quality of hire: The magic metric

  • Employee referrals: On the rise

  • Employer brand: A cross-functional priority

  • Retention and internal mobility: Time to align

  • Parting thoughts

  • Methodology

I like simple and straight forward reports like this. They tell you what the headlines are, give you charts and graphs that are easily understood, and then they end with a summary and the description of their methodology.

So the highlights are these:

  • Quality of hire is most important to talent acquisition practitioners, but there isn’t a lot of agreement on how to measure it
  • The use of employee referral programs is continuing to increase
  • Other functions, most notably Marketing, are getting in on the Employer Branding act

That’s about it. Not really surprising. But here is the really interesting part to me: the methodology.

  1. It’s a global survey – 3,894 talent acquisition decision makers in corporate HR departments who have some stake in the recruitment budget took the survey.
  2. Those responders were Linkedin members.
  3. They were from all over the world (see below).

Linkedin 2016 survey footprint

Although the report doesn’t specify that the numbers shown by country represent the number of survey respondents by country, we must assume that is the case. And if it is, I find it fascinating that only 200 U.S. respondents were included. It’s true this is a global survey. And it’s also true that the world of talent does not revolve around the U.S. But when 400 U.K. responses, 300 Australia/New Zealand responses and 231 Brazil responses are included – and only 200 U.S. responses were included – I’m not sure whether this analysis is compelling. The U.S. has ~7 milllion organizations; the U.K. has ~ 4 million; Australia and New Zealad have ~ 2 million; Brazil has ~1 million.

I’m not arguing that there are too many respondents from countries other than the U.S. There are some incredible talent innovations emerging all over the world in countries like India, Brazil and China. I’m positioning, rather, that there are too few respondents utilized from the U.S. I’m pretty sure that if the survey had included 400, or even 500, talent leaders from the U.S. instead of 200, the results would have been different. It’s hard to say how different, but different nonetheless. Having a more representative national sample vis a vis other nations would make the conclusions more compelling.

With a hat tip to Laurie Ruettimann, this raises the issue that we have to be mindful of the results of vendor research analysis. When sample size is too small, or when questions are ambiguous, or when the answer selections are biased (which they almost always are in vendor sponsored research), we really do need to take the results and analysis with a grain of salt.

There are interesting analyses and conclusions here that are worthwhile. But I wouldn’t build my budget from this report if I were a talent leader in the U.S. I appreciate that Linkedin, the world’s largest professional network – or whatever it is, is asking its members questions related to the talent acquisition challenges with which every employer around the world is grappling. And it’s interesting to see the results country by country. I’m just not sure the U.S. data are solid enough on which to build action.

What do you think?

3 Comments

Filed under China Gorman, Data Point Tuesday, HR Data, Laurie Ruettimann, Linkedin, Quality of Hire, Talent Acquisition

Annual HR Systems Survey Analysis Is Here!

data point tuesday_500One of the highlights of the HR Technology Conference each fall is the publication of the annual HR Systems Survey White Paper by Sierra-Cedar. With the retirement of long-time analyst Lexy Martin, Stacey Harris has stepped up magnificently and published a whopper of an analysis of all things HR tech, the 18th since 1997.

Sierra-Cedar encourages the dissemination of this white paper and I encourage you to download it here because it’s full of interesting survey data analysis. Here are a few high level nuggets from the executive summary:

  • This is the year of the Enterprise HR Systems Strategy: 43% of organizations are undertaking a major HR systems strategy initiative

  • HR organizations achieve higher levels of HR, Talent and Business outcomes by embracing their organization’s culture.

  • We’ve hit the tipping point: over 50% of purchased core HRMSs are SaaS solutions.

  • More than 50% of organizations are using new Talent Acquisition tools outside of their applicant tracking systems.

As organizations invest more time, attention and financial resources in HR management solutions, Sierra-Cedar sees three primary outcome models for these investments: Talent-Driven, Data-Driven and Top Performing. It’s good to see organization principles for how business spend their money and time. And these three buckets make good sense. We could probably all tick off well-known brands in each of those buckets. As a business leader, I find it interesting to see the comparison between talent-driven outcomes vs. data-driven outcomes.

Here’s one of many charts in the report that I found interesting:

Sierra Cedar 2015 2It is interesting to note here that the business outcome measures – especially market share and profitability – trend higher across the board. A great reminder that using data and business intelligence to be smart about talent makes the business more successful.

I love reading this report each year. It provides a frame of reference for what’s new, what’s old and what’s coming. If your organization is currently thinking through the effectiveness of any of your suite of HRMS solutions, this is a must read. If your organization is not currently thinking about the availability of HR related business intelligence, this is a must read. If your current HRMS solutions all live on premise, this is a must read. Come to think of it, if you’re in HR, this is a must read.

You can download it here. And then read it. Really. And then send Stacey Harris a thank you note.

2 Comments

Filed under China Gorman, Data Point Tuesday, HR Data, HR Technology, Sierra-Cedar

Get To Know Me: Here Comes GenZ

data point tuesday_500

We haven’t quite got GenY figured out, and here comes GenZ! Universum, the global employer branding firm, has conducted a GenZ survey and found some interesting conclusions. In Generation Z Grows Up we’re given a bit of a peek into this new generation that will be 40% of all consumers by 2020 (less than 5 years from now!) and there is news:

  • GenZ is spooked by the college debt of the Millennials

  • GenZ doesn’t think universities are preparing students for workplace success

  • GenZ perceives current high levels of unemployment following university/college graduation

And it appears that Gen Z’s current orientation to post-secondary education isn’t what we might expect:

Universum Gen Z 1It would appear that 62% of Gen Z would consider joining the economy right after high school – particularly if employers will invest in their training. Of course, as with all things global, attitudes are different around the world. On average, though, if only 38% of high school students globally are committed to enrolling in a university degree program before joining the world of work, there are a great many young people considering forgoing the traditional post-secondary education route in favor of less debt, more employer-sponsored training, and more employment opportunities. Maybe.

Universum has been surveying college/university and graduate school students about to graduate for almost 30 years. It probably has the biggest and most robust data set of student expectations and employer preferences in the world. The 2015 Gen Z survey asked more than 50,000 recent high school graduates about their future careers, higher education plans, as well as their attitudes about work and life. A real window into the next generation of employees.

I know it seems like we haven’t figured out the Millennials yet. But time is marching on and it’s time to meet and greet a whole new generation of employees. Given the dramatic demographic shifts we’re experiencing, we can’t get to know these newcomers fast enough. The first truly digital natives are sure to provide employers opportunities as well as challenges.

3 Comments

Filed under China Gorman, Data Point Tuesday, Gen Y, GenZ, Universum

Lights Out Productivity

data point tuesday_500One of the benefits of writing a blog that is focused on bringing interesting research analysis to the HR community is that people (vendors, academics, researchers, associations…) send me all kinds of research reports. I receive cool data analyses every day. And I learn a lot reading through them. Here’s a funky little survey analysis that won’t surprise anyone. But it brings up a good point.

The research goal of Generational Trends in Employee Desktop Expectations and Behaviors sponsored by AppSense, was “to capture hard data on experiences and attitudes towards desktop experience among business users.” The methodology included a series of online surveys that were fielded to independent sources of business professionals, all of whom worked at companies with more than 500 employees (1,000 employees in the U.S.) and lived in the U.S., the U.K., Germany, France, The Netherlands or Australia. All in, a total of 258 full-time business professionals who use a desktop computer for than 10% of their work participated in the survey.

If we needed to see more data that would drive a wedge between the Millennials and the Boomers, this would qualify. Except that the data aren’t surprising. Millennials grew up with technology in their hands, pockets and backpacks. Boomers grew up with almost no technology and when it did appear it wasn’t personal, mobile or transportable.

Generational Trends 2 October 2015So, while we all get distracted when our desktops are slow to load, how we spend our time while waiting is different. Evidently Millennials only know how to be productive on a computer.

Generational Trends October 2015On the face of it, it looks like Boomers try to be more work-productive while waiting for their slow desktops to catch up with them, and Millennials tend to be more personal-productive. What we don’t know is how much time these activities take – seconds, minutes, or more.

As I said, this is a funky little survey analysis. You certainly wouldn’t create any policy changes based on these findings. But you might ask questions about how much time is actually spent waiting for slow computers at your organization. If it’s minutes a week versus hours a week, you’re probably fine. If the available time due to slow computers is hours a week, the investment in alleviating the down time might be well-spent.

But the more interesting question this brings up for me is whether or not our workforce, now dominated by digital natives, can be productive when the lights go out. Are we’re teaching them how to be productive off the digital reservation? For sure the Boomers can go Old School and use paper, spreadsheets, telephones and other relics of bygone business eras to get work done if the systems go down. Is it possible that our younger colleagues don’t know non-digital ways of being productive? Is this funky survey and analysis an inadvertent call to ensure that productivity isn’t bound by turning on a computer and being connected to the internet?

Can your workforce continue to serve your customers and be productive if the systems go down for an hour? For a day? For several days?

I’m just sayin’.

2 Comments

Filed under AppSense, Baby Boomers, China Gorman, Data Point Tuesday, Desktop Computers, Millennials, Time Management

Conference Attendance 101

data point tuesday_500This was originally published on August 31, 2010 — it’s still valid today. Especially if you’re joining me at the HRTech Conference next week. Especially the part about smiling…

So.  You took advice from my last blog post and decided which conference to attend.  Congratulations.  But now you want to be sure that you leverage your investment by making the most of your attendance.  Here are three proven strategies for making sure you get your money’s worth.

Sessions

Conferences generally have 3 types of content sessions:

  1. General Sessions:  these are sessions that are intended for the full complement of attendees.  The speakers are typically big names in the industry who speak on universal topics relevant to the conference theme or they are big celebrity names meant to draw your attendance to the conference.  Here in Orlando where I’m attending the SHRM affiliated HR Florida conference, the opening general session featured Henry Winkler.  (He was terrific, by the way.)
  2. Concurrent Sessions:  these are the main content tracks that are scheduled throughout the conference.  Each time slot will hold multiple options for your consideration.  Designed for smaller subsets of the conference attendees, these tend to be led by practitioners, consultants or academics and are focused content of a practical nature.
  3. Sponsor Highlights:  these are sessions that feature a sponsor or exhibitor’s product or service, are marketing-focused in nature, and come as part of their sponsorship/exhibitor fee.

In a typical two and a half day conference, it’s important to select the sessions you want to attend wisely – and in advance.  But it’s also important not to over-schedule yourself (more on that later). I recommend attending all the General Sessions.  The big names generally have value and the celebrity speakers are generally engaging, entertaining and motivating.  Then attend concurrent sessions in about 75% of the time slots.

Save time for Networking

One of the particular values of attending a conference in person (as opposed to an online conference or a series of webinars) is the opportunity to meet other like minded people.  Look at the list of presenters.  Look at the list of sponsors/exhibitors.  Find out who else will be attending.  Then target 4-8 people that you’d really like to meet and talk with – and find them at the conference.  Leaving time in your session schedule to set short appointments when you find people on your target list will allow you to be thoughtful in creating new relationships.  Don’t pass up the opportunity to learn from industry pros – who, by the way, also want to network and meet people just like you!

You know how to network, right?  You prepare for these opportunities in advance by identifying what you’d like to talk about with each target and prepare 2 or 3 questions to get the conversation rolling.  You can ask everyone the same questions, or you can customize your approach to each person.  Your confidence will be strong as you introduce yourself to these folks and you’ll be surprised how amenable perfect strangers are to meet and talk with you.

Nothing is more attractive than a smile

As you walk the conference halls and expo aisles, make sure your demeanor and body language is open.  And smile.  Intentionally.  You’ll appear open, friendly, not intimidating or intimidated.  Really, there’s nothing more attractive than a smiling face.  And there’s nothing that builds your confidence to approach strangers than acting open and welcoming.

Attending a conference and getting your money’s worth isn’t hard.  But it takes some forethought and planning.  Both you and your organization want to realize the investment it took to get there.  Make sure you get the full value of the experience.

Leave a comment

Filed under Bill Kutik, China Gorman, Data Point Tuesday, Globoforce, HR Technology, HR Technology Conference, LRP Publications, Steve Boese

How Bad is Your Succession Management?

data point tuesday_500

84% of organizations report having a lack of candidates in the pipeline ready to assume open and critical positions.

That’s not good, folks. As we wring our hands on the lack of talent in the external pipeline, perhaps we should be spending more time attending to the skills and development of the folks already in the organization!

Laci Loew, Vice President and Principal Analyst at Brandon Hall Group, recently published their State of Succession Management 2015. If your organization is in the 84% of organizations above, this report will be helpful in laying out the challenge, what and how high performing organizations in this regard are executing differently, and how to think about the first steps of moving your succession planning needs forward. The report is a great read and has some pretty terrific content and data included.

This graph gives you a taste of what you can expect in terms of getting started as well as what successful outcomes are from both succession management and business focus perspectives.

Brandon Hall Succession Mgmt 1

The report outlines 7 critical findings of Brandon Hall’s research on this topic:

  1. Talent pipeline health continues to threaten leadership continuity.

  2. Succession management commitment is on the rise with prioritization for a formal strategy for all parts of the organization.

  3. Technology is under-utilized, hindering efficiency of succession management.

  4. Successor development as a critical component of succession management is improving.

  5. Lateral mobility takes center stage as a critical successor development strategy.

  6. Using predictive analytics to proactively plan for critical position vacancies will separate organizations with effective succession management from less effective organizations.

  7. Today’s succession management budgets are modest at best, but expected to expand significantly over the next 12 months.

The insights fleshed out in each of these key findings are critical reading for any talent management professional. And you’ll also get some useful data to use in building the ROI for succession management investment in next year’s budget.

The report is published by Skillsoft and can be accessed here. At 34 pages, this is a solid piece of analysis and a useful and highly practical read.

2 Comments

Filed under Brandon Hall Group, China Gorman, Data Point Tuesday, Laci Loew, Skillsoft, Succession Planning, Talent Management, Talent pipeline

Today’s Frontier is NOT Technology

data point tuesday_500I’m not sure where I ran across this report from Interact Authentically, Disengagement and Separation of the Virtual Worker. But I’m glad I found it. What actually caught my eye as I was reading it, were the last two sentences:

“We cannot forget our most basic core goal in business: to create connections and relationships. Today’s frontier is not the technology required to run a global company – it is applying technology while bringing along the nurturing, engaging aspect of human communication.”

That really resonates with my work on the WorkHuman project with the Globoforce folks.

The report, published in January, analyzes a survey conducted by Harris Interactive among 2,026 adults over 17 years old in the United States. Here’s an interesting data point that may interest you: nearly two-thirds (63%) of U.S. employees report that they ever work virtually. Surprised? I was. Given the heated discussions about the lack of workplace flexibility and work/life integration, that’s a lot of people with at least some flexibility. And over two-thirds of those folks think their management needs to communicate better in order to keep them engaged.

Other findings of note:

Interact Sept 29 2015The message seems clear – flexibility to work from home isn’t enough for employees. They still need to feel the love from their bosses. In fact, working from home requires managers to do more to keep their employees feeling engaged and that they have a human, real relationship with the organization, their work, and their boss.

Certainly not rocket science. But a good reminder that the big challenge isn’t finding the right technology to enable more flexible work arrangements. The big challenge is keeping the humanity flowing when employees are isolated from their colleagues and bosses.

Here’s a thought: maybe Marissa Mayer wasn’t crazy after all!

2 Comments

Filed under China Gorman, Data Point Tuesday, HR Data, Interact Authentically, Work Life Balance, Workflex

It’s All About the Recruiters

data point tuesday_500

Jobvite’s annual Recruiter Nation Survey is out today. In its eighth year, the survey was conducted in July 2015 and completed by 1,404 recruiting and human resources professionals in a wide range of industries.

Much of the survey data is not surprising: use of social media tools by recruiters is strong and growing; referrals are still the most effective source of quality hires; hiring activity is up; the hunt for talent will remain or get more competitive in the next 12 months. No surprises here.

Here’s a surprise, though: only 4% of recruiters DON’T use social media tools in the recruiting process. But the tools used go way beyond Linkedin, Facebook and Twitter.

Jobvite 1 Sept 2015

While referrals continue to be the most effective source of good hires, the frequency that other sources provide similar results is interesting. It looks like job boards are the Scott Walker of candidate sources – they started out strong (57% of recruiters reported using them in the 2009 report) but are fading as time passes.

Jobvite 2 Sept 2015Buried on the last page of the survey analysis is some data that I found interesting having to do with what recruiters are putting in their budgets. With the rise of the RPO sector, and a seemingly robust executive search/staffing sector, only 13% of recruiters are increasing their spend in the use of outside agencies. That seems counterintuitive to me. Employment branding is the other category surprise with fully 46% of internal recruiters increasing their spend. That verifies that employment branding is a thing.

Jobvite 3 Sept 2015There are lots of vendor whitepapers out there. Many do a good job of sharing useful data and analysis that prove to be useful at the practitioner level while burnishing their corporate brand. This one does both. It also has some pretty terrific graphics and the visual style is engaging. It’s 16 pages long and is a quick read. Download it here.

11 Comments

Filed under China Gorman, Data Point Tuesday, Employee Referrals, JobVite, Recruiting, Recruiting Technology, Social Media, Social Recruiting

Watson Says Multiple Channels of Recognition Mean Higher Engagement

data point tuesday_500

Here’s what I like about whitepapers from IBM’s Smarter Workforce Institute: they are short in length and long on data and context. I appreciate that they share the underlying scientific concepts within their analyses of the data from their massive WorkTrends™ survey. 19,000 workers in 26 countries, a cross-section of industries, all major job families, and thousands of organizations responded to the 2013/2014 survey. Watson is all about slicing and dicing data and he came up with some interesting, although not surprising, conclusions about the impact of multiple channels of employee recognition.

In a point in time when organizations are grasping at any reasonable straw to increase engagement, decrease turnover and compete more successfully in the talent market, new approaches to employee recognition appear to be providing significant outcomes and ROI. Legacy recognition programs that attempt to reward employees for sticking around for 3, 5, 10 and 15 years have long ceased to motivate engagement or even longevity. Who would stick around one day longer to ensure they got an ebony clock on their 5 year service anniversary?

This survey analysis, How do I recognize thee, let me count the ways, explains concepts like Reinforcement Theory, ERG Theory and Social Exchange Theory to provide context for these findings that link recognition to engagement:

  • Employees who receive recognition are more likely to be engaged at work. The engagement level of employs who receive recognition is almost three times higher than the engagement level of those who do not.

  • Workers who receive recognition are less likely to quit. Without recognition, about half (51%) of surveyed employees say they intend to leave, with recognition just one quarter (25%) say they intend to leave their organizations.

  • Employees whose organizations use multiple communication channels for recognition are more likely to feel appreciated and show a higher level of employee engagement. The more channels used for recognition, the higher the employee engagement level.

  • The findings imply that technologies such as social and mobile could be strong candidates for the effective delivery of recognition as they offer interactive, frequent and immediate communication via multiple channels.

When voluntary quits in the U.S. are at their highest levels since early 2008, and the number of open jobs are at their highest level since 2000, it’s no wonder that employers are increasingly turning their attention to strategies that encourage employees to engage more and leave less. And because employers spend around 1% of their total payroll on reward/recognition programs, many are beginning to look at the ROI of that spend – and are frankly willing to spend more to increase their ROI. A negative ROI on 1% of payroll isn’t a good investment. But a positive ROI on 2% of payroll? That requires a new context and solid evidence that the investment will pay off. Data analysis like that found in this report, helps organizations create the appropriate business case for moving reward/recognition programs into the 21st century.

The important takeaway from this analysis is that one channel of recognition communication doesn’t cut it anymore (if it ever did). The data clearly suggest that multiple technology-enabled channels including social and mobile increase the financial and engagement ROI of recognition programs. Years of service awards don’t move the needle any more.

IBM SWI Recognition whitepaperAt a point in time where nearly half of employers are considering implementing new or additional recognition programs in the next 12 months, adopting approaches that use multiple technology-enabled channels appear to be the smart way to go. At least that’s what Watson thinks.


4 Comments

Filed under Big Data and HR, China Gorman, Data Point Tuesday, Employee Engagement, Employee Recognition, IBM Smarter Workforce, Watson