Tag Archives: China Gorman

People Are Fuel

data point tuesday_500

A couple of weeks ago I wrote about the astonishing shift in corporate valuations (here) – from overwhelmingly reliant on tangible assets to overwhelmingly reliant on intangible assets. I wasn’t alone in noticing this research. Aon Hewitt did as well. And mentioned it in an interesting executive brief, People Fuel Growth, The Role of Human Capital in Maximizing Growth.

What’s noteworthy about this brief, that reports findings from their recent study, is its organizational growth model that makes organizational strategy less of a focus than the people strategy. In other words, “people (culture) eat strategy for breakfast.”

Take a look at their simple growth model:

Aon Hewitt 1

Two of the external environment challenges noted in the brief are worth mentioning:

  • 70% of FORTUNE 1000 companies have disappeared in the last 70 years
  • Corporate profits peaked in 2015 and appear to be trending downward

These, together, with the results of pretty dramatic demographic shifts mean that as people are the driving force of corporate value, they are becoming themselves more valuable and more important to business growth. It’s pretty inescapable that people do, in fact, drive growth – and not through execution alone.

I look forward to seeing the complete study analysis that will expand on the conclusions in this brief.

Advertisement

1 Comment

Filed under Aon Hewitt, business strategy, China Gorman, Corporate Valuation, Data Point Tuesday

Gender Equity And The Great Manager Divide

data point tuesday_500

Gender equality in the workplace is a topic much discussed today:  politically, socially, economically and demographically. Women everywhere wonder “what’s it going to take?” to be paid on par with men for doing the same work. Visier’s new Viser Insights™ Report:  Gender Equity gives some new insight into the demographic and economic side of this situation. It’s great data and will give you some new avenues to pursue as you lead your organization to more equitable compensation outcomes.

The analysis started with a subset of Visier’s database of anonymized, stardardized workforce data, representing over a million active employees. The subset included:

  • 165,000 U.S.-based employees
  • 31 Blue Chip companies
  • 11 of which are Fortune 1000

The organizations included are from a range of industries, such as Energy, Financial Services/Insurance, Healthcare, Manufacturing, and Technology with employees ranging from less than 999 to 50,000 employees.

The key findings broaden the context from a purely social context and include the following:

  • There is an increase in voluntary turnover and a pronounced dip in the percentage of women in the workforce between the ages of 25 and 40 (from 43% to 39%), the same age range in which women commonly have childre

  • The gender wage gap widens at age 32, starting with women earning 90% of the wages of men, and decreasing to women earning 82% of the wages of men by age 40

  • Women are underrepresented in manager positions from age 32 onwards – the same age at which the wage gap between men and women broadens

  • Manager wages are, on average, 2 times that of non-manager wages

  • Having the same representation of women in manager positions as men would reduce the gender wage gap to 10% across all age groups – an improvement most notable for the age 32 and older population

The graphs lay out this argument beautifully and are easily understood. For example,

Visier 1

What the analysis shows is that the gap in promotions/hiring to manager-level positions starts to widen at around age 32 between women and men. And this is exactly when women start leaving the workforce to focus on family and children. Makes total sense. This is what Visier has dubbed the Manager Divide. And, according to Viser’s data, the Manager Divide is a primary driver of wage inequality.

Visier 2This is a pretty clear picture of the divide. Conclusions include:

  • Removing the Manager Divide would reduce the gender wage gap by just over one third for workers over age 32

  • Removing both the Manager Divide and removing gender pay disparity in manager positions would cut the gender wage gap by one half for employees over age 32

The report continues by discussing the reality that even if organizations paid men and women equally for like positions, but had a lack of gender equity in filling manager positions, gender pay equity would not be reached in the aggregate. What follows is a convincing discussion about the childcare years that starts with this data point:

“Between the ages of 25 and 40 there is a notable and steady decline in the percent of women in the workforce. At the same time, the percent of women (out of the total workforce) in manager positions declines steeply.”

I encourage you download this report and get a broader understanding of the key factors impacting the wage gap. I think Visier is on to something important through the analysis of the data. The Manager Divide is real. It’s not just about women leaving the workforce to care for children. It’s most certainly also about gender equity in managerial promotion opportunities.


3 Comments

Filed under Analytics, China Gorman, Data Point Tuesday, Gender Equity, Pay Equity, Visier

Are You Putting All Your Eggs Into The Engagement Basket?

data point tuesday_500

George LaRocque, Founder and Principal Analyst at #HRWINS, has published a new report that caught my eye. Where Purpose Meets Performance:  Can HR Tech Solve Culture, is an interesting look at the culture challenges of the U.S. middle market (5,000 and fewer employees) which employs roughly 90% of the U.S. workforce.

Here’s where he grabbed me:

“Studies show that companies with performance enhancing cultures far out-perform those without it in terms of revenue growth, stock price growth, and net income growth. Yet, it remains nearly impossible to tie HR and people programs to business results. Business leaders and HR practitioners have looked to employee engagement as a measure of successful corporate culture but first even defining employee engagement presents a challenge. There have long been efforts to standardize its definition and measurement, and the result has been just the opposite. We’ve seen a proliferation of science and methods narrowly looking at everything from happiness to community embeddedness, social network analysis, motivation and incentives, collaboration, personality and culture assessments, and more.”

What follows is an interesting discussion, with 3 strong case studies, that shows how the acquisition and deployment of core HR technology is supporting the increase in HR credibility and impact on corporate performance, as well as greater employee satisfaction. It’s interesting stuff and incudes results from several surveys that George put out in the field.

At 20 pages, it isn’t a long read and is well organized. The main points cover the following:

  • What employees rate as the leading drivers of their feeling of engagement.
  • What employers feel are the HR and people programs delivering the best ROI.
  • How employee engagement fits in the new world of work.
  • What role core HR technology plays in building culture and aligning with business performance.

The survey work underpinning this analysis lead George to believe as I do:

“…perhaps the strongest component of culture that resonates with employees, of ALL generations, is having purpose and meaning in their work.”

The survey results, as shown below, show that, at least in the vast middle market, Baby Boomers and GenX are the most interested demographic as it relates to meaning and purpose. That’s not what you expected, is it? But it tracks with my research and observations.

#HRWINS 1

This report includes several such graphs and data points that provide solid context for whatever thinking and planning you’re doing regarding culture, engagement and your employee experience. Putting all your eggs in the “engagement” basket will most likely not produce the returns you expect. There are stronger fundamentals that may well have a stronger positive impact on your employees’ experience. Especially if you’re in the middle market.

Leave a comment

Filed under #HRTechTrends, #HRWINS, Baby Boomers, China Gorman, Culture, Data Point Tuesday, Employee Engagement, GenX, George LaRocque, HR Technology, Millennials

Tangible Vs. Intangible Assets

data point tuesday_500

You might not be aware of a trend in the corporate valuation world. You might not think that developments in how companies are being valued by the financial world would be of interest to HR. But, hold on to your horses! Validation of “our people are our greatest asset” is here!

Ocean Tomo LLC, the Intellectual Capital Merchant Banc™ firm, publishes an annual study of intangible asset market value. The most recent, published in early 2015, includes a rather eye-popping chart. But first a couple of definitions.

Tangible Asset (from Investopedia):  A tangible asset is an asset that has a physical form. Tangible assets include both fixed assets, such as machinery, buildings and land, and current assets, such as inventory. The opposite of a tangible asset is an intangible asset.

Intangible Asset (also from Invetopedia):  An intangible asset is an asset that is not physical in nature. Corporate intellectual property (items such as patents, trademarks, copyrights, business methodologies), goodwill and brand recognition are all common intangible assets in today’s marketplace.

Tangible assets are things. Physical things. Intangible assets are the results of human intellect and work. And the financial value of those – tangible and intangible assets – have completely reversed in the last 40 years. Completely!

Ocean Tomo provides the following chart showing this complete reversal.

Ocean Tomo Intangible AssetsIf ever the argument was made that our people are, in fact, our biggest asset, this nails it. In 1975 tangible assets comprised 83% of the S&P 500 market value; in 2015 intangible assets made up 84% of the S&P 500 market value. That means people, human beings are the greatest driver of corporate value — and not by a little bit.

So here’s the question:  if the finance/valuation world is truly valuing our organizations based on the value of our human capital, why is it so hard to talk about – much less act upon – the value of building cultures fit for human beings?

Something to think about during this week’s heat wave.

4 Comments

Filed under China Gorman, Company Culture, Culture, Data Point Tuesday, Human Capital, Ocean Tomo

Engaged and Committed or Dazed and Confused?

data point tuesday_500

There are a great deal of research and writing about engagement. Sometimes, I think it’s all we see. And there are a lot of solutions providers who will help you measure engagement, diagnose why engagement is low, increase engagement – and any other thing you want to do with or about engagement.

Here’s the challenge:  every one defines engagement in a different way. It’s enough to drive you crazy. It drives me crazy. Maybe not dazed and confused, but definitely crazy. I spend most of my time at the intersection of corporate culture, business performance, what I call humanity. You could just as easily call it engagement – except I think humanity is bigger than engagement.

My particular bias against “engagement” notwithstanding, my friends at Effectory International in Amsterdam have published a very interesting report introducing their compilation of this year’s Global Employee Engagement Index (vol. 3). I am interested in this report for three reasons:

  1. I know and like these folks a lot
  2. I actually like their definition of engagement
  3. They’ve indexed engagement globally – in 54 countries around the world

It’s pretty interesting reading. Here’s how they think about engagement:

The basis of engagement – or what people want from work:

Effectory 1

This is a much more complete definition than most. I like the “compelling company culture” language – not a one-size-fits-all definition of culture. I like the inclusion of freedom (see www.worldblu.com ) at work. And I especially appreciate the inclusion of immediate managers in the mix, along with exceptional leaders in the C-Suite.

I also think that their data have credibility because they can show regional differences in engagement drivers around the world:

Effectory 3

With data that show a global average of engaged and committed employees of 29%, they are also able to break it out by region:

Effectory 2

The discussion that follows is engaging (see what I did there?) and the analysis of this year’s data covers topics like:

  • Why businesses need employee engagement
  • What people want from work
  • Why engaged and committed employees leave
  • Specific strategies for strengthening the four “pillars” of engagement

There are several case studies, as well as a number of key takeaways that you’ll want to note as you think about your culture and your employees.

You may not have heard of Effectory International, but you should get acquainted with their work through this analysis and report. It may reduce your level of dazedness and confusion. I think you’ll thank me.

2 Comments

Filed under China Gorman, Culture, Data Point Tuesday, Effectory International, Employee Engagement, Employee Loyalty, Engagement, Freedom at Work, Global Employee Engagement Index, WorldBlu

Employer Branding Now

data point tuesday_500

Universum, the global employer branding and market research organization, recently published a new report on the state of employer branding practices. It’s good. If you’re unclear about what employer branding is, this report is for you. If you’re involved – at all – with talent acquisition, this report is for you. If you’ve created your EVP (employee value proposition) and are headed into activation, this report is for you. Because talent is everything in today’s hyper competitive global marketplace, employer branding is becoming a critical part of talent strategy.

The report, Employer Branding Now, is a comprehensive review of what leading organizations around the world are doing to become more successful in connecting with the talent they need. Without giving away the store, the following graph shows how overall investments in recruitment channels are shifting. No surprise that investments in social channels are increasing, along with employee referral programs and alumni networks. On the other side of the coin, it’s probably not surprising that print advertising is sinking rapidly. And while you may have thought job boards were dead, that just isn’t the case. But check out the third-party recruiter channel. Are you surprised?

Universum EBnow

Food for thought here, I think!

The report is the outcome of a yearly survey of approximately 2,500 employer branding managers from around the world. The respondents represent a wide range of industries, and include 100 of the FORTUNE 500.

The actionable insights that conclude the report give helpful direction to those in the thick of employer branding activation, as well as those just starting to work on their EVP:

  1. Create closer alignment between employer brand priorities and talent priorities.

  2. Fully leverage the power of EVPs to deliver greater employer brand focus and impact.

  3. Balance brand consistency with talent segmentation and local targeting.

  4. Invest in quality social media content (no longer a side order, now the meat of the day).

  5. Invest in analytics – effective employer brand strategies are increasingly numbers driven.

The report is delivered in a colorful and easy to read eBook format. It’s a good read with attractive and easily understood graphs and data points. You can get it here.


Full disclosure: I chair Universum’s North America Board.


Leave a comment

Filed under China Gorman, Data Point Tuesday, Employer Branding, FORTUNE Magazine, Global Human Capital, HR Analytics, Human Resources, Recruiting, Social Recruiting, Talent Acquisition, Universum

The ROI of Working Human

data point tuesday_500

The SHRM Foundation’s latest Effective Practice Guideline, Creating a More Human Workplace Where Employees and Business Thrive, was released just in time for the SHRM Annucal conference this week. The timing couldn’t have been more appropriate, as it follows on the heels of last month’s WorkHuman conference.

If you’ve been following Data Point Tuesday for a while, you know I’m a big fan of the SHRM Foundation’s EPGs. They are researched, written, and reviewed by leading academics in the Human Resources field, and are underwritten by some of the most innovative suppliers in the HR arena. This EPG, sponsored by Globoforce, brings a great deal of data and analysis into one easily read report. In other words, it’s chock full of validated research and data on a topic that is becoming top of mind for CEOs, boards, and all C-Suite members:  the connection between employee well-being and business success.

The business case for creating a more human workplace is made in the first section of the report. It includes Strategies that pay off, High costs of our current work culture, and Multiple benefits of a thriving work culture. A few of the gems from this section include:

  • The American Psychological Association estimates that workplace stress costs the U.S. economy $500 Billion (!) a year.

  • Workplace stress increases voluntary turnover by nearly 50%.

  • Gallup estimates that poor leadership associated with active worker disengagement costs the U.S. economy $450 – $550 Billion (!) per year.

  • 550 Billion workdays are lost annually due to stress on the job.

  • 60 – 80% of workplace accidents are attributed to stress.

The supporting data showing how detrimental most workplace cultures are to their financial success are proliferating. Even if treating employees as if they were human beings wasn’t the right thing to do, the numbers alone make it hard to understand why creating more humanity-focused cultures aren’t the leading priority for every single organization and for every single CEO!

Once past the business case, the report lays out a thorough treatment on how to fix your culture in the section, Seven Ways to Help Employees Thrive. Not rocket science, but rather simple common sense, these seven elements come with case studies, examples and specific “how tos” for you to consider in your own organization.

  1. Share Information About the Organization and Its Strategy
  2. Provide Decision-making Discretion and Autonomy
  3. Create a Civil Culture and Positive Relationships
  4. Value Diversity and Create an Inclusive Atmosphere
  5. Offer Performance Feedback
  6. Provide a Sense of Meaning
  7. Boost Employee Well-Being

Citing employers like Alaska Airlines, Genentech, General Mills, Ritz-Carlton, Microsoft and many others, author Christine Porath loads this EPG with practical tips, examples and evidence.

At its heart, however, humanity-focused workplaces start at the top. They start with trustworthy leadership and sustainable leadership behaviors. This graphic says it all:

EPG May 24 2016

This report shows, once again, that there is absolutely no downside to not only treating employees humanely, but consciously and intentionally investing in their well-being. When our employees feel respected as individuals, appreciated for their contributions, and supported in their family lives and community commitments, as well as their physical health and mental well-being, our organization missions are more likely to come to fruition and all of our stakeholders – every single one of them – will be more than happy with the return on their various investments.

Thanks to the SHRM Foundation’s newest EPG, The ROI of Working Human has never been more clear.


1 Comment

Filed under China Gorman, Christine Porath, Company Culture, Culture, Data Point Tuesday, Effective Practice Guidelines, Employee Engagement, Employee Stress, Engagement, Globoforce, HR Data, SHRM Foundation

Human Capital Trends To Think About

data point tuesday_500

Deloitte’s Human Capital Trends 2016 Report, The new organization: different by design, is definitely worth a read. It’s long – 124 pages – but it will make you smart. Download it and start browsing.

I won’t say much about the content – you need to read it all – except to show you the 10 trends identified as worth our consideration this year. The trends are:

  1. Organization design/The rise of teams

  2. Leadership awakened/Generations, teams, science

  3. Shape culture/Drive strategy

  4. Engagement/Always on

  5. Learning/Employees take charge

  6. Design thinking/Crafting the employee experience

  7. HR/Growing momentum toward a new mandate

  8. People analytics/Gaining speed

  9. Digital HR/Revolution not evolution

  10. The gig economy/Distraction or disruption?

This is a meaty, insightful discussion of the trends facing organizations, leaders, culture and people. Even if you don’t agree with the conclusions, you need to be educated and thoughtful about these ten trends. Take a look:

Deloitte HCM Trends 2016

Down the report here. Now. It’s that important.


1 Comment

Filed under China Gorman, Data Point Tuesday, Deloitte, Global Human Capital, HR Analytics, HR Data, HR Trends, Human Capital, Human Resources, Josh Bersin

Your People and Global Internet Trends

data point tuesday_500

Data Point Tuesday’s mission is to find reports and impactful data sources that most HR professionals would never find and serve up some of their more interesting data points for consideration. Usually the reports come out of the Human Capital Management arena:  academic papers, vendor survey analyses, white papers, etc. There’s a ton of data flowing in our space that the average HR person would never have the time to find. It’s what I do here. But sometimes the best data and analytics sources don’t come out of the HCM arena. And the annual Internet Trends reports is one of those sources.

I have been waiting with bated breath for Mary Meeker’s Internet Trends 2016 report – and it’s here! Last year, I suggested that the report really should have been titled The Internet in 2015 Is All About HR. I wrote about it here. This year, I think the report should be titled How the Internet is Just Beginning to Change Everything at Work. Again, it should be required reading for HR professionals everywhere.

The annual Internet Trends report that Meeker publishes is certainly not an HR report. But it contains critical information and data that HR people need to know. It’s all big picture stuff that relates to the Internet, but it also all has impact on people – and most of it has impact on people at work. In the U.S., in Asia, in Europe – all over the world. I encourage you to flip through the report – it’s in PowerPoint – even though it’s really long. This is the outline – and I defy you to not find the majority of it interesting and relevant to your HR work, your workforce planning and your role in setting business strategy.

Here are the topics covered in this year’s report:

  1. Global Internet Trends
  2. Global Macro Trends
  3. Advertising/Commerce + Brand Trends
  4. Re-Imagining Communication – Video/Image/Messaging
  5. Re-Imagining Human-Computer Interfaces – Voice/Transportation
  6. China = Internet Leader on Many Metrics
  7. Public/Private Company Data
  8. Data as a Platform/Data Privacy

Every single one of these topics has an impact on how you interact with your people, your people strategy or your people policies. Seriously.

For example, as you think through your internal communication strategy, this graph might be helpful:

Internet Trends 2016 1

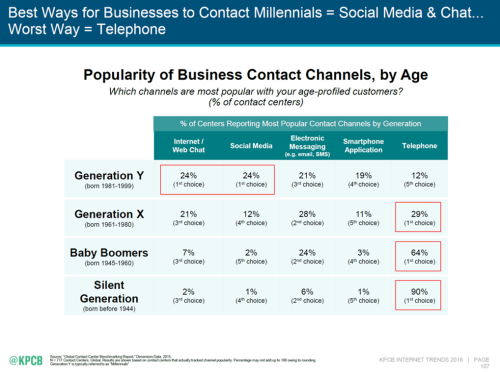
Think it’s useful to know that 64% of Baby Boomers cite the telephone as their most preferred contact channel vs. 12% of Millennials? (It won’t be shocking, I hope, to note that Millennials prefer – by 48% — social media and internet/web chat channels.) While you might instinctively know this, seeing the hard data puts the need to rethink employee communication into a different perspective, doesn’t it.?

The advent of using microphones instead of keyboards to interface with computing is in very early days, according to Meeker. However, in 2013 35% of smartphone owners used voice assistants (think Siri) and 65% used the voice interface in 2015. Adoption is rising fast among smartphone owners of all ages. Even if the majority of voice commands are about calling and navigating home, the use is skyrocketing. And as the Boomers age, think of the impact – at home and at work – of not needing to use a keyboard to utilize technology. Is your organization prepared for this radical shift?

In the US, the reasons for using voice interface and the locations we are using it are not so focused on the job. But the trends are pretty clear. What can you do to anticipate and leverage this and enhance productivity, knowledge transfer and the employee experience?

Internet Trends 2016 2

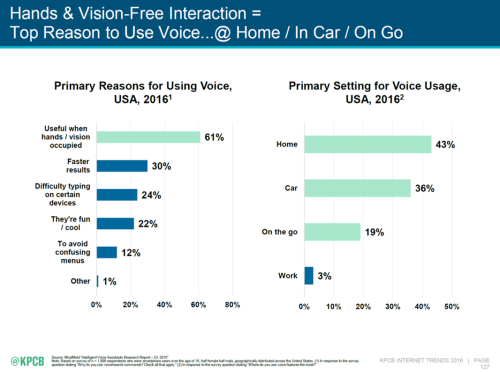
So if calling mom and dad, and navigating (literally) home are the current most often uses of using voice for computer activation, then the charts above make an inordinate amount of sense. But if you keep the oldest demographic of the workforce in mind when reading these charts, you can see that a sea change could be on the very near horizon. What if the oldest demographic of the workforce isn’t going away in the next 10 years? Even more, what if enabling/convincing the oldest demographic of the workforce to stay in the workforce was the key to your workforce plans over the next 10 years? And what if the newest/youngest demographic of the workforce was already using voice for computer interaction nearly 100% of the time as they enter the economy?

Interesting data. Interesting questions. See what I mean about non-HR sources of data?

And just to leave you wishing for the good old days, there’s this graph comparing the attributes of technology use among the emerging Gen Z cohort to the Millennials:

Internet Trends 2016 3

As my dad used to say, “If that doesn’t make your hair curl, I don’t know what will!”

The workplace and workforce planning implications of this report put the future in new light. A good light, I think. A challenging, but good light. And a light you need to focus. What do you think?

3 Comments

Filed under Analytics, Big Data and HR, China Gorman, Data Point Tuesday, Employee Demographics, GenX, GenY, GenZ, Internet Trends, KPCB, Mary Meeker, Millennials

I’m Not Your Mother!

data point tuesday_500

This is a popular post from a year ago. I was reminded of it at the WorkHuman conference earlier this month.

Some things are simple. Some things are complicated. And some things that seem simple are actually pretty complicated. For example, it seems like a simple observation that happy employees are better employees. And, in fact, data abound to prove that point. But how to get happy employees is a little more complicated.

Early in my career as a business leader I always believed that people were my critical competitive edge and that creating a strong, caring culture was my job. But happiness? Come on. I wasn’t my employees’ mother. The nature of the employer/employee relationship, I believed, was a commercial relationship. Employees come to work, do a good job and I pay them. The more I could remove obstacles from their ability to do good work, the more I could offer development and thanks for a job well done, the better they performed. It wasn’t rocket science. Treat people well and they’ll treat your employees well. I got that. But trying to make them happy? I didn’t think that was part of the deal. (And I was a pretty effective business leader.)

But as I matured as a leader, I did begin to wonder about this notion of working to create happiness at work. I spent some time at Zappos – a culture whose leader is all about making his workforce happy. And while the Zappos culture wouldn’t be a fit for me, it worked for them. And they were happy. Really happy. And their business results were such that they could sell the business to Amazon for over $1 billion.

And then I became CEO of the Great Place to Work Institute and was covered over in data that prove a direct line from employee well-being to financial performance. And so while early in my career the notion of employee happiness didn’t register as a leadership imperative, I now believe that creating a culture that, in Tony Hseih’s words, delivers happiness to employees is quite clearly a practical and effective way to achieve top line growth, profitability, customer loyalty and, most importantly, employee loyalty.

In preparation for the Globoforce WorkHuman Conference in a couple of weeks, I was reading up on employee happiness and ran across one of their white papers, The Science of Happiness. It’s a quick read and makes some rather simple but profound points backed up by reliable data.

Here are 6 reasons why you want happy employees based on research from the Wall Street Journal and the iOpener Institute. Happy employees:

  • Stay twice as long in their jobs as their least happy colleagues
  • Believe they are achieving their potential 2x as much
  • Spend 65% more time feeling energized
  • Are 58% more likely to go out of the way to help their colleagues
  • Identify 98% more strongly with the values of their organization
  • Are 186% more likely to recommend their organization to a friend

Download the paper. It’ll take you less than 10 minutes to read and will give you some simple ideas to begin to see the benefits of focusing on employee well-being and happiness. And then join me at the WorkHuman Conference next year and let’s talk about happiness, gratitude, culture, and employee and organization success.

Leave a comment

Filed under China Gorman, Conferences, Culture, Data Point Tuesday, Employee Engagement, Engagement, Globoforce, Gratitude, WorkHuman