Tag Archives: Employee Demographics

The Workforce: Not As Simple as Red or Blue, Male or Female, or Generation

Jobvite’s annual Job Seeker Nation Study was published a couple of weeks ago. They took a whole new approach, given the current political environment in the U.S., and it’s fascinating. Subtitled, Finding the Fault Lines in the American Workforce, it looks at how divided our nation really is when it comes to attitudes and actions related to changing jobs.

“If the past year taught us anything, it’s that we live in a divided nation. In fact, nearly 80% of Americans – an all-time high – believe the country is split in two. With this year’s Job Seeker Nation Survey of 2,000 Americans, we sought to define that split:  who are the two groups and what does the job seeking experience look like for each? The answer surprised us:  ‘Divided America’ is a myth. Sure, from 30,000 feet you see Blue vs. Red. Coast vs. Coast. But dig a couple layers deeper and you don’t find a neatly divided population… What we found is many different versions of the American job seeker.”

And then we’re off to the races with fascinating data points covering the workforce, job seekers, men, women, quitters, stayers, generations – different slices of workforce data that are sure to make you stop and think about what’s really happening with your employees.

The finding that I found most interesting had to do with job sampling. For example, more than half of the respondents are satisfied at work (64%) – but 81% of them are open to new job opportunities. Additionally, 50% had at least one interview this year to explore options – with no intention of leaving their current position! Additionally, job seekers are not as happy as they used to be. In the last year, the percentage of workers satisfied at work has plummeted 10 percentage points to 64% (from 74%). But more concerning is that 82% are open to new job opportunities. That’s a tough message for employers.

Another fascinating data point – despite greater transparency around pay, performance and the like – is that workers routinely “sample” their options by interviewing for new jobs.
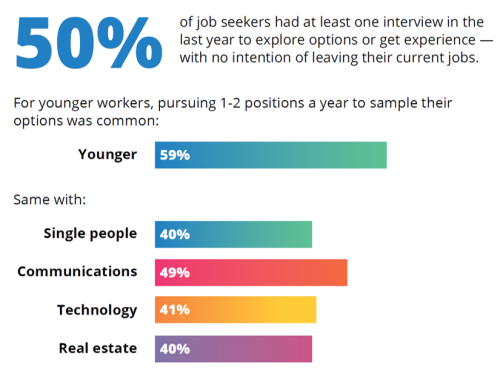
The dynamics of the workforce in 2017 are clearly not cut and dried – and certainly not as simple as Generation vs. Generation or Male vs. Female. Of course, we knew that. But this report shines a light on some more nuanced slices of the data and provides some surprising results.

I look forward to this report each year. (Here’s my take on last year’s report.) The Jobvite folks always serve up a different set of data points that add depth to the planning and conversations employers are having about their workforces. This year is no different. Take a look here. You’ll find some useful insights.


1 Comment

Filed under Big Data and HR, China Gorman, Data Point Tuesday, Employee Demographics, Employment Data, Generations at work, HR Data, Human Capital

Your People and Global Internet Trends

data point tuesday_500

Data Point Tuesday’s mission is to find reports and impactful data sources that most HR professionals would never find and serve up some of their more interesting data points for consideration. Usually the reports come out of the Human Capital Management arena:  academic papers, vendor survey analyses, white papers, etc. There’s a ton of data flowing in our space that the average HR person would never have the time to find. It’s what I do here. But sometimes the best data and analytics sources don’t come out of the HCM arena. And the annual Internet Trends reports is one of those sources.

I have been waiting with bated breath for Mary Meeker’s Internet Trends 2016 report – and it’s here! Last year, I suggested that the report really should have been titled The Internet in 2015 Is All About HR. I wrote about it here. This year, I think the report should be titled How the Internet is Just Beginning to Change Everything at Work. Again, it should be required reading for HR professionals everywhere.

The annual Internet Trends report that Meeker publishes is certainly not an HR report. But it contains critical information and data that HR people need to know. It’s all big picture stuff that relates to the Internet, but it also all has impact on people – and most of it has impact on people at work. In the U.S., in Asia, in Europe – all over the world. I encourage you to flip through the report – it’s in PowerPoint – even though it’s really long. This is the outline – and I defy you to not find the majority of it interesting and relevant to your HR work, your workforce planning and your role in setting business strategy.

Here are the topics covered in this year’s report:

  1. Global Internet Trends
  2. Global Macro Trends
  3. Advertising/Commerce + Brand Trends
  4. Re-Imagining Communication – Video/Image/Messaging
  5. Re-Imagining Human-Computer Interfaces – Voice/Transportation
  6. China = Internet Leader on Many Metrics
  7. Public/Private Company Data
  8. Data as a Platform/Data Privacy

Every single one of these topics has an impact on how you interact with your people, your people strategy or your people policies. Seriously.

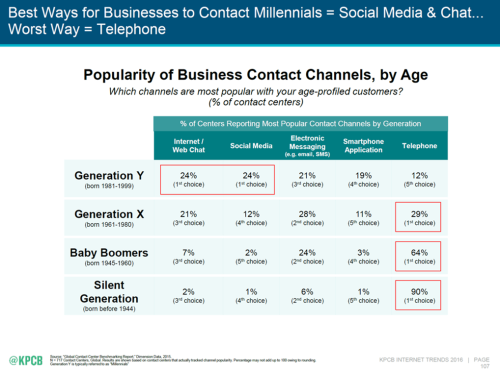
For example, as you think through your internal communication strategy, this graph might be helpful:

Internet Trends 2016 1

Think it’s useful to know that 64% of Baby Boomers cite the telephone as their most preferred contact channel vs. 12% of Millennials? (It won’t be shocking, I hope, to note that Millennials prefer – by 48% — social media and internet/web chat channels.) While you might instinctively know this, seeing the hard data puts the need to rethink employee communication into a different perspective, doesn’t it.?

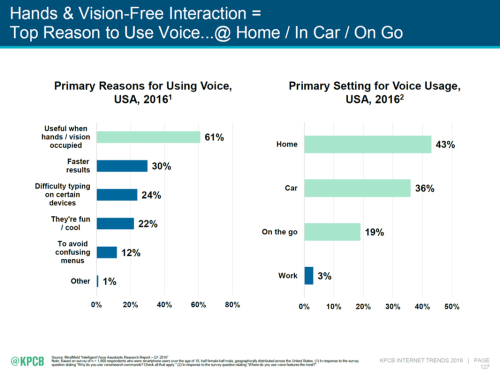
The advent of using microphones instead of keyboards to interface with computing is in very early days, according to Meeker. However, in 2013 35% of smartphone owners used voice assistants (think Siri) and 65% used the voice interface in 2015. Adoption is rising fast among smartphone owners of all ages. Even if the majority of voice commands are about calling and navigating home, the use is skyrocketing. And as the Boomers age, think of the impact – at home and at work – of not needing to use a keyboard to utilize technology. Is your organization prepared for this radical shift?

In the US, the reasons for using voice interface and the locations we are using it are not so focused on the job. But the trends are pretty clear. What can you do to anticipate and leverage this and enhance productivity, knowledge transfer and the employee experience?

Internet Trends 2016 2

So if calling mom and dad, and navigating (literally) home are the current most often uses of using voice for computer activation, then the charts above make an inordinate amount of sense. But if you keep the oldest demographic of the workforce in mind when reading these charts, you can see that a sea change could be on the very near horizon. What if the oldest demographic of the workforce isn’t going away in the next 10 years? Even more, what if enabling/convincing the oldest demographic of the workforce to stay in the workforce was the key to your workforce plans over the next 10 years? And what if the newest/youngest demographic of the workforce was already using voice for computer interaction nearly 100% of the time as they enter the economy?

Interesting data. Interesting questions. See what I mean about non-HR sources of data?

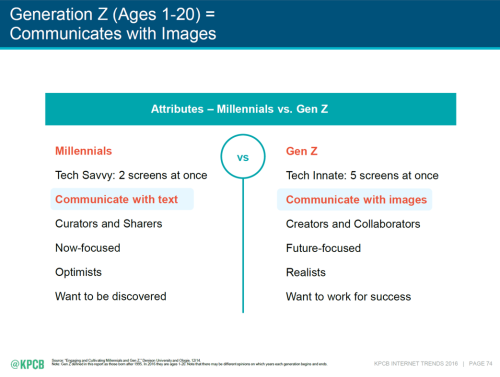
And just to leave you wishing for the good old days, there’s this graph comparing the attributes of technology use among the emerging Gen Z cohort to the Millennials:

Internet Trends 2016 3

As my dad used to say, “If that doesn’t make your hair curl, I don’t know what will!”

The workplace and workforce planning implications of this report put the future in new light. A good light, I think. A challenging, but good light. And a light you need to focus. What do you think?

3 Comments

Filed under Analytics, Big Data and HR, China Gorman, Data Point Tuesday, Employee Demographics, GenX, GenY, GenZ, Internet Trends, KPCB, Mary Meeker, Millennials

What Do You Know About the Hourly Workforce?

data point tuesday_500

Here’s an eye opener:

“As of 2014, hourly workers make up 56.7 percent of the United States workforce. Think about that for a moment. More than half of all people working the U.S. make an hourly wage. That’s 77.2 million workers aged 16 and up. Yet there is little data to be found about the hourly worker. The U.S. Census publishes a total number of hourly workers and breaks that number down by very broad age characteristics, full-time vs. private sector and race. But that’s all. The segment is so ignored that even the monthly unemployment report doesn’t categorize the workforce by salary vs hourly. The U.S. Department of Labor recognizes them only in an annual report on minimum wage workers. To understand the majority of laborers in the United States, we are left to guess.”

redeapp is changing this through the commission of a series surveys and reports from Edison Research. The first, Profile of The Hourly Worker: Demographics, Devices and Disconnection, crossed my desk right before the end of 2015. And it’s pretty interesting.

Redeapp provides private and secure communications platforms that connect companies with their hourly, front-line employees and those without company email access. So they have a vested interest in having a deep understanding of this segment of the workforce. What they’ve found, in some cases, seems counter-intuitive. Like this, for example:

Profile of Hourly Worker 1.png

If the data are to be believed, more than 30% of the U.S.’s hourly workforce has 1-3 years of college or more – with fully 24% having some graduate credits or an advanced degree! I would not have expected that 49% of our hourly worker population would have a 4-year college degree – or a high school degree and some college credits.

Another surprise: email is used by this segment of the workforce multiple times each day in their general work responsibilities. But here’s the rub: only 50% of this segment have an email address provided by their employer. And 42% report that they use their personal email account for work communication either sometimes or often. How many liabilities and risks can we count here?

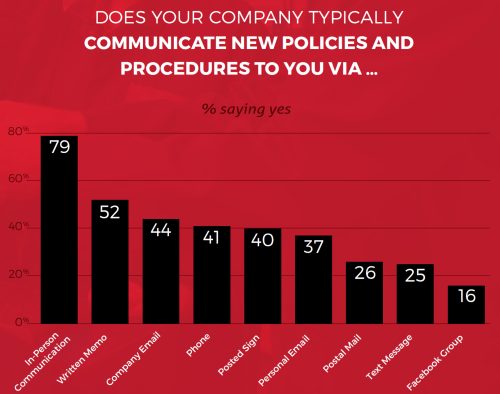
Given that scenario, this chart becomes very interesting:

Profile of Hourly Worker 2

The risk and control issues that exist in an un-secured corporate communication environment are quite large. Clearly, understanding hourly workers and how to communicate with them is a priority for organizations that employ this segment of the workforce. And perhaps, this segment of the workforce isn’t quite what you pictured.

Take a look at this survey report. It’ll make you think about your communication strategies. In a good way.

1 Comment

Filed under Big Data and HR, Bureau of Labor Statistics, China Gorman, Corporate Risk Management, Data Point Tuesday, Employee Demographics, Employee Loyalty, Hourly Workers, HR Analytics, HR Data, redeapp, Strategic Workforce Planning, Uncategorized, Workforce Management

Required Reading for HR: Internet Trends 2015

data point tuesday_500Really. I’m not kidding. You may think from the title that Internet Trends 2015 is a report that has nothing to do with Human Resources. You couldn’t be more wrong. It’s ALL about HR. And how nearly everything about business, work and the employer/employee relationship is changing because of what the internet enables.

The report, prepared by Kleiner Perkins Caufield & Byers’ Mary Meeker for this year’s Code Conference, presents the 2015 Internet Trends report, 20 years after the first The Internet Report was published in 1995. You’ve probably heard about this year’s report because every journalist in the world was agog at one piece of data: how Millennials relate to their smartphones. Everyone now knows that 87% of Millennials in the U.S. report that “my smartphone never leaves my side, night or day.” That’s one of several data points on one page of a 196 page report. And while interesting, it is among the least interesting data points in the report. I promise.

But first. You need to know some definitions to get the full value of the report. Here are a few terms and acronyms you should – and probably already – know:

  • MAU = Monthly Active Users (how many users are on an application at least once a month)
  • DAU = Daily Active Users (how many users are on an application at least once a day)
  • Y/Y = Year over Year (compares results from two consecutive years)
  • API = Application Programming Interface (how programs/apps connect to each other)
  • GDP = Gross Domestic Product (total value of goods and services produced by a nation)
  • GMV = Gross Merchandise Value (total sales value of merchandise sold through an internet channel)
  • VoIP = Voice over Internet Protocol (Skype would be a good example)

This report hits on all of HR’s buttons with high impact data: the nature of work, the job market, benefits, age demographics in the workplace, freelancers, government benefits, union participation, employer retirement plans, healthcare, the impact of drones on work, what’s happening in China and India and more. All in a report about internet trends. And almost every page is a data-rich picture of how things are changing. This might be my favorite page because it is the continuous thread of everything else discussed in the report:

KPCB 2015 Trends 2

And this might be my favorite chart because the impact of the data here fuels most everything else mentioned in the report. The connections between economic growth/decline, demographic changes, the internet and business impact every HR person everywhere, every day. Everywhere. Every day. This report shows these connections clearly.

KPCB 2015 Trends 1I’d like to make this report mandatory reading for all HR professionals. If you’re having a hard time grasping what the opportunity really is for HR to keep ahead of the profound changes happening all around us, this report will help you understand. Read it. Discuss some of the findings (pay particular attention to the section at the end, Ran Outta Time Thoughts) in staff meetings and with other leaders in your organization. Develop a point of view about how internet trends are impacting your organization and your people, and begin to strategize responses that will work for your business and your people. You must.

And oh yes, read this report.

6 Comments

Filed under #HRTechTrends, China Gorman, Data Point Tuesday, Employee Demographics, GDP, Human Resources, Internet Trends, KPCB, Mary Meeker