Tag Archives: Generations at work

The Workforce: Not As Simple as Red or Blue, Male or Female, or Generation

Jobvite’s annual Job Seeker Nation Study was published a couple of weeks ago. They took a whole new approach, given the current political environment in the U.S., and it’s fascinating. Subtitled, Finding the Fault Lines in the American Workforce, it looks at how divided our nation really is when it comes to attitudes and actions related to changing jobs.

“If the past year taught us anything, it’s that we live in a divided nation. In fact, nearly 80% of Americans – an all-time high – believe the country is split in two. With this year’s Job Seeker Nation Survey of 2,000 Americans, we sought to define that split:  who are the two groups and what does the job seeking experience look like for each? The answer surprised us:  ‘Divided America’ is a myth. Sure, from 30,000 feet you see Blue vs. Red. Coast vs. Coast. But dig a couple layers deeper and you don’t find a neatly divided population… What we found is many different versions of the American job seeker.”

And then we’re off to the races with fascinating data points covering the workforce, job seekers, men, women, quitters, stayers, generations – different slices of workforce data that are sure to make you stop and think about what’s really happening with your employees.

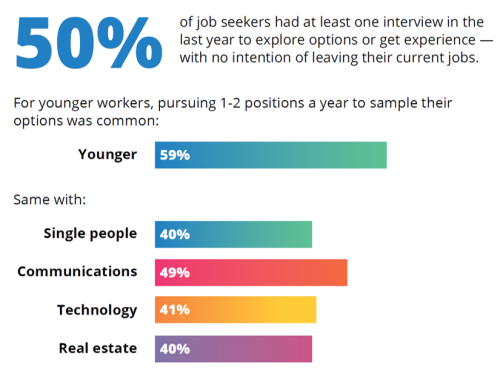
The finding that I found most interesting had to do with job sampling. For example, more than half of the respondents are satisfied at work (64%) – but 81% of them are open to new job opportunities. Additionally, 50% had at least one interview this year to explore options – with no intention of leaving their current position! Additionally, job seekers are not as happy as they used to be. In the last year, the percentage of workers satisfied at work has plummeted 10 percentage points to 64% (from 74%). But more concerning is that 82% are open to new job opportunities. That’s a tough message for employers.

Another fascinating data point – despite greater transparency around pay, performance and the like – is that workers routinely “sample” their options by interviewing for new jobs.
The dynamics of the workforce in 2017 are clearly not cut and dried – and certainly not as simple as Generation vs. Generation or Male vs. Female. Of course, we knew that. But this report shines a light on some more nuanced slices of the data and provides some surprising results.

I look forward to this report each year. (Here’s my take on last year’s report.) The Jobvite folks always serve up a different set of data points that add depth to the planning and conversations employers are having about their workforces. This year is no different. Take a look here. You’ll find some useful insights.


1 Comment

Filed under Big Data and HR, China Gorman, Data Point Tuesday, Employee Demographics, Employment Data, Generations at work, HR Data, Human Capital

Are You Planning For Your Future Workforce?

Accenture’s strategy group has published an interesting look at the workforce of the future:  Harnessing Revolution, Creating the future workforce. At an easily consumable 28 pages, it focuses on three primary areas of emphasis for organizations wanting to get a competitive leg up in the hyper competitive talent markets:

  1. Accelerate reskilling people
  2. Redesign work to unlock human potential
  3. Strengthen the talent pipeline from its source

If you’re starting to discuss talent acquisition, development, and retention strategies with your C-Suite, you’re a little late – and this report will be helpful in scoping out the known and unknown challenges barreling down the pike.

The report is full of good news like data presented that show workers being optimistic about the impact that technology will bring to their work life:  “…instead of resenting technology, 84 percent report being excited about the changes it will bring. A full 87 percent are downright optimistic, projecting that it will actually improve their work experience in the next five years.” So that’s some good news we’ve haven’t seen before.

As an advocate for humans and humanity in the workplace, I was especially pleased to see an emphasis in the report on the value that human skills bring to the enterprise:  “our model shows fewer jobs will be lost to automation if people are able to reallocate their skills to tasks that require more ‘human skills’ such as complex analysis and social/emotional intelligence.” The following figure shows that perhaps the gross fears of automation and job eliminations may not be grounded in fact:

The challenge of job loss due to automation is clearly real. But as this report shares, reallocation of skills will significantly decrease job loss. Accenture’s research shows that investments in reskilling the workforce will “dramatically” reduce job loss: “Estimates for Europe show that a one percent increase in training days leads to a three percent increase in productivity, and that overall productivity growth attributable to training is around 16 percent.”

The section on focusing on reskilling people is short and sweet:

  1. Reskill at the top of the house
  2. Keep building on what you have
  3. Change the mindset to “learning as a way of life”
  4. Use digital to learn digital

While, paragraphs 2 – 4 are expected, paragraph 1 is not. Accenture’s research points to a lack of technology skill and experience in the boardroom. And from a leadership perspective, leading in horizontal rather than hierarchical ways will be foundational. Investing in additional skills at the top of the house could make or break your workforce planning outcomes.

There are lots of nuggets in this report. It’s a pretty quick read and the data sources include Accenture, of course, and the likes of the World Economic Forum, Manpower Group, ILO, OECD, Harvard Business Review, Pew Research Center, INSEAD and many others. Citing these sources is one of the reasons I really like the report. This isn’t the usual white paper.

If you’re really getting into the weeds of planning for your future workforce, this is a strong addition to your data sources. Not only is the report useful, but the list of source material could keep you going for weeks.


2 Comments

Filed under Accenture, China Gorman, Data Point Tuesday, Demographics, Future of Work, Generations at work, Gig Economy, HR Data, HR Trends, Human Capital, Strategic Workforce Planning, Talent Management, Workforce Demographics, Workforce Planning

Got Culture?

data-point-tuesday_500

Gallup’s State of the American Workplace report is out. It’s a lot of information (214 pages!). But it’s important information and you’ll enjoy the most current data from this global collector and analyzer of work related data.

We talk about employee engagement – or some other euphemism for connecting with employees in a human, caring way – all the time. We get at our data through the famous surveys from organizations like Gallup, Great Place to Work™, Quantum Workplace, or Workplace Dynamics – or any of a hundred other providers of culture measurement and strengthening solutions. And we compete in geographical and industry competitions all over the world to claim one of the top spots in great organizational culture lists. All of this to attract and retain world class employees.

I’m a big believer that culture trumps most every other organizational dynamic in the war for talent, innovation, profitability, top line growth, competitiveness and any other thing you might measure. I’ve been quoted frequently as saying that “strong, positive  cultures improve everything we measure that we want to go up, as well as reducing everything we measure that we want to go down.” And it’s true. But intentionally creating and managing the right kind of culture is getting more difficult as the world gets more and more complex: 4 or 5 generations in the workplace; Big Data and Artificial Intelligence; globalization; nationalism; terrorism; population growth; global warming – the list of external dynamics – some might say threats – impact  our organizations’ success as well as how we relate with our employees seems to grow every day.

So, I appreciate organizations that collect data, make sense of it, and then make it available to all of us. I appreciate them a lot. And Gallup does a better job than most. This report, State of the American Workplace, has a ton of interesting data in it. You probably don’t want to read it in one sitting, but you do want to read it all.

In the executive summary, the report lays out the roadmap for leaders to follow in creating organization sustainability:

  • design and deliver a compelling and authentic employer brand
  • take employee engagement from a survey to a cultural pillar that improves performance
  • approach performance management in ways that motivate employees
  • offer benefits and perks that influence attraction and retention
  • enable people to work successfully from locations besides the office
  • construct office environments that honor privacy while encouraging collaboration
  • improve clarity and communication for employees who work on multiple teams

Sounds simple, I know; but any leader who has tried to create a stronger culture knows that this is hard stuff. It’s 3 steps forward, 2 steps back stuff. And Gallup has the data to back it up.

The executive summary ends with this:

“The one thing leaders cannot do is nothing. They cannot wait for trends to pass them by, and they cannot wait for millennials to get older and start behaving like baby boomers.”

The chapters are mini culture theses in themselves:

  1. U.S. workers: increasingly confident and ready to leave
  2. Do employees want what your workplace is selling?
  3. The real truth about benefits and perks
  4. The competitive advantage of engaging your employees
  5. A shift in managing performance
  6. A closer look at the 12 elements of engagement
  7. Making sense of matrixed teams
  8. The changing place and space of work

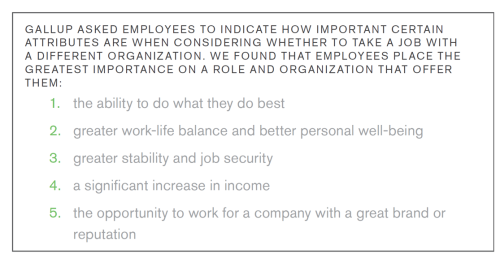
I encourage you to delve into these chapters and consider the data, the analysis and the conclusions in each. In chapter 2, data are shared that might motivate you to reconsider how you think your employment candidates are evaluating your organization as a potential employer:

gallup-american-workplace-2017-1

Increase in income potential and a well-known brand are not as important as they once were. Did you know that?

There are a number of similar “ah-ha” data points in this report. They are easily accessible, simply constructed and are potential game changers as you think about your organization’s culture and its impact on your ability to retain and acquire the talent you need.

Download it here. I think you’ll gain surprising new insights.

4 Comments

Filed under Big Data and HR, China Gorman, Company Culture, Data Point Tuesday, Employee Engagement, Employee Satisfaction, Gallup, Generations at work, HR Analytics, HR Data, HR Trends, Human Capital, Talent Analytics, Talent Management, Workplace Culture

Generations At Work

data-point-tuesday_500

I was doing some research for a client and came across this report from Monster:  Monster Multi-Generational Survey, published in 2016. The underlying survey was concluded in January 2016 and surveyed more than 2,000 across the Boomer, X, Y and Z generations.

I’m actually not a big fan of reports that show how differently each generation at work needs to be treated. I’m more in the camp of how to bring people together rather than solidify their differences. However, this is a very useful report. It’s not long, but it’s full of interesting tidbits. In its descriptions of each of the four generations active in the workplace today, these are the top motivators by generation:

Boomers:

  • Health insurance (66%)
  • Boss they respect (59%)
  • Salary (57%)

GenX:

  • Salary (59%)
  • Job security (39%)
  • Job challenges/excitement (35%)

GenY:

  • Salary (63%)
  • Job challenges/excitement (37%)
  • Ability to pursue their passion (36%)

GenZ:

  • Salary (70%)
  • Ability to pursue their passion (46%)
  • Job security (32%)

The generational differences are fascinating. And it’s our job to figure out how to retain these differently motivated employees while we bring them together into effective work groups. A daunting challenge to be sure.

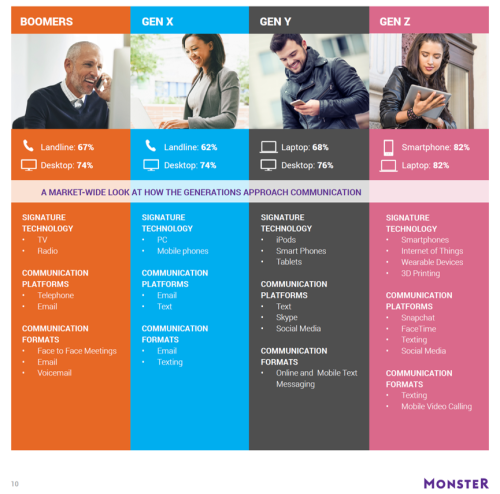
Of particular interest, I think, are the data that describe the differences in technology demands and expectations between the generations. This is a fascinating glimpse into how each generation relates with technology at work and which technology tools they view as most important:

monster-multi-generational-survey-2016

This is a terrific overview of the workplace preferences of each generation. And while we don’t want to build walls between the generations, we certainly do want to leverage technology in a way that will enable higher levels of productivity as well as more complete and effective communication.

I’m always looking for ways to break down walls between employees and create stronger more compelling workplace cultures. Using information like this to more effectively communicate and to build strong relationships make this report interesting.

You can download the report here. It’s a pretty quick read – well worth the investment of your time.


3 Comments

Filed under China Gorman, Data Point Tuesday, Generations at work, HR Data, Human Capital, Monster

Generations at Work: Working Hard or Hardly Working?

data point tuesday_500

I’m not a big fan of over-generalizing the characteristics of the different generations in the workforce. It’s just too easy to say “Millennials are entitled;” “Baby Boomers aren’t good with social media;” or “Gen Xers are lazy.” Too easy, and not at all true. Any of it.

So I read with some interest the results of a survey about the work habits of the generations that Paychex recently published. There are some interesting takeaways about who wastes time at work – and in what industries, geographic location, organizational role, exempt status and education level – in addition to the obligatory age demographic comparison. It’s interesting food for thought.

Here’s one of the comparison graphics:  this one compares time wasted at work by role, exempt status, and education.

paychex-1

Other comparisons include

  • Industries that waste the most and least time surfing the Internet
  • Regions that waste the most time surfing the Internet at work
  • Most common time-waste reducers
  • Comparing generational work habits
  • Hardest working generations, industries, and education levels
  • Hardest working regions in the U.S.

If you have a sense that you’ve got a time-wasting problem in your organization, this information could be helpful as you work on a solution. If you’re interested in how the generations stack up in the “who works hardest” rodeo, you’ll definitely find this interesting.

1 Comment

Filed under China Gorman, Cyberloafing, Data Point Tuesday, Generations at work, Paychex, Wasting time at work