Category Archives: Employee Loyalty

Engaged and Committed or Dazed and Confused?

data point tuesday_500

There are a great deal of research and writing about engagement. Sometimes, I think it’s all we see. And there are a lot of solutions providers who will help you measure engagement, diagnose why engagement is low, increase engagement – and any other thing you want to do with or about engagement.

Here’s the challenge:  every one defines engagement in a different way. It’s enough to drive you crazy. It drives me crazy. Maybe not dazed and confused, but definitely crazy. I spend most of my time at the intersection of corporate culture, business performance, what I call humanity. You could just as easily call it engagement – except I think humanity is bigger than engagement.

My particular bias against “engagement” notwithstanding, my friends at Effectory International in Amsterdam have published a very interesting report introducing their compilation of this year’s Global Employee Engagement Index (vol. 3). I am interested in this report for three reasons:

  1. I know and like these folks a lot
  2. I actually like their definition of engagement
  3. They’ve indexed engagement globally – in 54 countries around the world

It’s pretty interesting reading. Here’s how they think about engagement:

The basis of engagement – or what people want from work:

Effectory 1

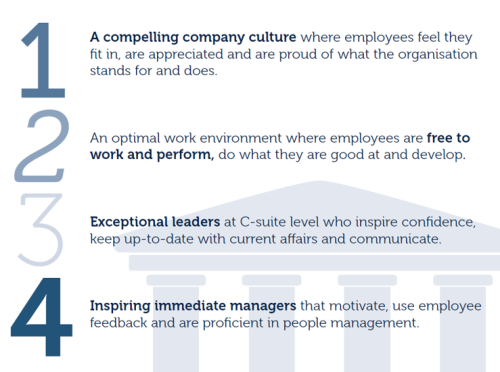
This is a much more complete definition than most. I like the “compelling company culture” language – not a one-size-fits-all definition of culture. I like the inclusion of freedom (see www.worldblu.com ) at work. And I especially appreciate the inclusion of immediate managers in the mix, along with exceptional leaders in the C-Suite.

I also think that their data have credibility because they can show regional differences in engagement drivers around the world:

Effectory 3

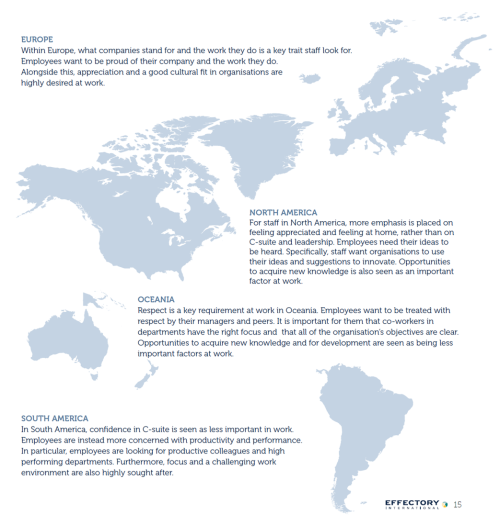
With data that show a global average of engaged and committed employees of 29%, they are also able to break it out by region:

Effectory 2

The discussion that follows is engaging (see what I did there?) and the analysis of this year’s data covers topics like:

  • Why businesses need employee engagement
  • What people want from work
  • Why engaged and committed employees leave
  • Specific strategies for strengthening the four “pillars” of engagement

There are several case studies, as well as a number of key takeaways that you’ll want to note as you think about your culture and your employees.

You may not have heard of Effectory International, but you should get acquainted with their work through this analysis and report. It may reduce your level of dazedness and confusion. I think you’ll thank me.

Advertisement

2 Comments

Filed under China Gorman, Culture, Data Point Tuesday, Effectory International, Employee Engagement, Employee Loyalty, Engagement, Freedom at Work, Global Employee Engagement Index, WorldBlu

What Do You Know About the Hourly Workforce?

data point tuesday_500

Here’s an eye opener:

“As of 2014, hourly workers make up 56.7 percent of the United States workforce. Think about that for a moment. More than half of all people working the U.S. make an hourly wage. That’s 77.2 million workers aged 16 and up. Yet there is little data to be found about the hourly worker. The U.S. Census publishes a total number of hourly workers and breaks that number down by very broad age characteristics, full-time vs. private sector and race. But that’s all. The segment is so ignored that even the monthly unemployment report doesn’t categorize the workforce by salary vs hourly. The U.S. Department of Labor recognizes them only in an annual report on minimum wage workers. To understand the majority of laborers in the United States, we are left to guess.”

redeapp is changing this through the commission of a series surveys and reports from Edison Research. The first, Profile of The Hourly Worker: Demographics, Devices and Disconnection, crossed my desk right before the end of 2015. And it’s pretty interesting.

Redeapp provides private and secure communications platforms that connect companies with their hourly, front-line employees and those without company email access. So they have a vested interest in having a deep understanding of this segment of the workforce. What they’ve found, in some cases, seems counter-intuitive. Like this, for example:

Profile of Hourly Worker 1.png

If the data are to be believed, more than 30% of the U.S.’s hourly workforce has 1-3 years of college or more – with fully 24% having some graduate credits or an advanced degree! I would not have expected that 49% of our hourly worker population would have a 4-year college degree – or a high school degree and some college credits.

Another surprise: email is used by this segment of the workforce multiple times each day in their general work responsibilities. But here’s the rub: only 50% of this segment have an email address provided by their employer. And 42% report that they use their personal email account for work communication either sometimes or often. How many liabilities and risks can we count here?

Given that scenario, this chart becomes very interesting:

Profile of Hourly Worker 2

The risk and control issues that exist in an un-secured corporate communication environment are quite large. Clearly, understanding hourly workers and how to communicate with them is a priority for organizations that employ this segment of the workforce. And perhaps, this segment of the workforce isn’t quite what you pictured.

Take a look at this survey report. It’ll make you think about your communication strategies. In a good way.

1 Comment

Filed under Big Data and HR, Bureau of Labor Statistics, China Gorman, Corporate Risk Management, Data Point Tuesday, Employee Demographics, Employee Loyalty, Hourly Workers, HR Analytics, HR Data, redeapp, Strategic Workforce Planning, Uncategorized, Workforce Management

Connecting Dots: Employee-style

data point tuesday_500

Back in July, I referenced data from the Glassdoor Q2 2012 Employment Confidence Survey.  If you’ll recall, this quarterly survey monitors four key indicators of employee confidence:  job security, company outlook, salary expectations and re-hire probability.  The Q4 2012 Survey from Glassdoor is out and the results are interesting.

It’s probably not shocking to anyone who reads this blog that half (51%) of employees (including self-employed people) will consider looking for a new Glassdoor logojob if the state of the economy stays the same or improves, with 33% looking for a new job in less than a year and nearly one in five (18%) planning to look for a new job in the next three months.  We’re hearing that our employee base is not engaged and other sources have said that as much as 90% of the employed population will look for a new job in 2013.

Glassdoor ECS Q412 - consider looking for a new job

What’s interesting to me is that, if you look at other data points in this survey, it makes perfect sense that a high percentage of employees think they’ll look for work this year. Why?  Well, according to the survey, 39% of employees don’t expect a pay or cost-of-living increase in 2013 and 21% aren’t sure if they’ll get an increase this year.

Glassdoor ECS Q412 - salary-expectations (2)

So.  60% of employees don’t think – or aren’t sure – they’ll get an increase this year.  I’m thinking that has something to do with the percentage of employees who will be looking for a new job this year.  And guess what?  The most important factor these employees say that will influence their decision on whether or not to accept a job offer is…wait for it…salary and compensation!

Employees are pretty good at connecting dots:

I don’t think I’m going to get a raise this year   +

I’ll be looking for a new job this year  =

The most important factor in my decision to accept a new job will be the salary and compensation

Makes perfect sense to me.

But I also think that a majority of employees will receive raises of some sort this year.  Even small ones.  So why do so many think that there is no soup for them?

Perhaps we’re causing this supposed exodus ourselves by not communicating clearly – at the employee level – what our compensations plans for this year are.  Or, maybe we’re being extremely clear and they don’t believe us.

Either way, it’s a problem.  Either way, we should never forget that our employees are smart and know how to connect the dots.

Maybe it’s time we do the same.

2 Comments

Filed under China Gorman, Compensation, Connecting Dots, Employee Loyalty, Engagement, Glassdoor, HR Data

Data Point #9: Employer Loyalty Isn’t Dead? Wait. What?

MetLife published its 10th Annual Study of Employee Benefit Trends on March 19th, 2012.  At 80 pages, it’s a read.  But it’s a fascinating read.

The report shows clearly that the strong role of workplace benefits in driving employee attraction, retention and productivity continues as reported by these MetLife studies during the last 10 years and persists today during the slow economic recovery.  Interestingly, the study correlates satisfaction with benefits to employee job satisfaction, and also shows clearly that employees who are dissatisfied with their benefits are more likely to want to work somewhere else.

The data are fascinating.  And I recommend the investment of 30 minutes to read it through.

The data point that I found most interesting in the study follows:

I haven’t seen anyone discuss employer loyalty to employees in a long time.  I think I assumed, by looking at other trends, that the issue of employer loyalty was long dead.  Building employee loyalty, however, was a whole other discussion:  we call it employee engagement.  And employers are starting to pay attention to this issue because of the rapid shift in workforce demographics coming down on us like a load of bricks. (See my posts on this topic here and here.)

But where has been the focus on employer engagement? Have we all assumed that employer loyalty is dead and gone forever?  That employees “know the score” and don’t expect employers to be loyal to them?  Well, MetLife reports that between 2008 and 2011 employer loyalty scores have increased 5% from 52% to 59%!  Wait.  What?

In the same time period, however, the perception by employees that their employers are loyal to them has decreased 8% from 40% to 32%.  How pitiful is that?  Employers think they’re doing better, but employees aren’t getting the message.  And in fact, more of them aren’t getting the message as time goes on.

I think this is interesting.  Despite all the attention being paid to employee engagement – through salary, through benefits, through recognition, through providing strong ethical cultures, through providing meaningful and interesting work — in fact, the study finds evidence of a widening disconnect between employers and employees.

Job insecurity and expectations that benefits will be cut may well be contributing to employees feeling less important to their employers.  This “loyalty gap” presents an immediate opportunity for HR and C-Suite leaders to really step up communication and feedback about their increased loyalty.  Of course, the proof is in the pudding, and for employees to believe that their employer is growing more loyal to them, they are going to have to see a change in behavior – if they stick around long enough.

6 Comments

Filed under China Gorman, Culture, Demographics, Employee Benefits, Employee Loyalty, Employer Loyalty, Engagement, MetLife, Talent pipeline, Uncategorized