Category Archives: Workforce Management

Are HR And Finance Finally Going To Be Friends?

How on earth can it be August 1st? For that matter, how on earth can it be 2017? After taking off three weeks for vacation and business travel commitments, it’s time to be back considering new research and data of interest to the HR community. And here’s an interesting report from Oracle and MIT Technology Review.

My friends at Oracle sent it to me, and I’m glad they did. The report might signal the start of a new era of respect, cooperation, and, dare we say, organizational friendship between HR and Finance. Finance and HR: The Cloud’s New Power Partnership is a recent publication providing interesting data, analysis, and commentary about the Cloud’s opportunity to drive greater partnership, cost savings and actionable data through a strong HR and Finance relationship. It’s a quick read at 14 pages, and it’s based on survey data collected from 700 respondents that included senior managers and their mid-level management counterparts from Finance, HR, and IT, as well as more holistically inclined C-level executives. Organizations participating were from the Americas, Europe, the Middle East and Africa, and Asia. About 75% of the participating companies generate annual revenue between $250 million and $1 billion from a range or industries. So a global sample of large employers. Just the segment that would be wrestling with the Cloud opportunities. And just the segment that would see value in a closer relationship between HR and Finance.

Among businesses that participated in the survey, 35% plan to create a shared finance and HR function within a year… 42% of respondents say they are motivated by improvements in productivity and performance. Respondents view closer finance and HR collaboration in the cloud as a strategic necessity, promoting operation excellence and accelerating innovation.

Wait a minute. I think I felt the ground move! Shared Finance and HR function? Within a year? That’s an eye popper right there. Not because it doesn’t make sense:  it really does. HR is becoming more data driven every day. And Finance has been data driven for years. Getting them together to analyze people data’s impact on the business and its growth plans is critical. And getting HR and Finance together through a technology bridge makes sense. Both HR and Finance need more and more data to manage the business. More and more analytics capabilities. More and more ability to predict the future based on today’s data. It’s fascinating to me that technology may be the puzzle piece that finally brings HR and Finance together. And the results – so far – look substantial:

These outcomes, though pretty generic, show an enormous upside opportunity for HR and Finance to migrate jointly to the Cloud. When do we ever get these kinds of outcome ratings on large-scale organization change initiatives? Or just on HR projects? Or just on Finance projects? It seems as if organizations are succeeding in generating real benefits from moving to the Cloud by creating teams from natural adversaries. And how interesting it is that the IT team is the attractor beam bringing HR and Finance together.

The report shares a few short case studies – from the education, energy, and financial services sectors – that underscore the benefits of integrated ERP-HCM Cloud systems deployments. (Note: this is a white paper. Underwritten by Oracle.) There are a number of interesting graphs in the report all underscoring these benefits. And they’re interesting to think about.

This is a quick read and it could help inform your thoughts about moving more HR functions to the Cloud. And to get you thinking about the inevitability of working more closely with your colleagues over in Finance. Better to have some informed opinions before your CEO, CHRO, CFO, or CTO starts asking questions…


1 Comment

Filed under Analytics, Big Data and HR, China Gorman, Cloud Migration, Data Point Tuesday, HR Data, HR Technology, MIT Technology Review, Oracle, Technology Implementation, Workforce Management

The Future Is Now

data-point-tuesday_500

Deloitte’s annual human capital report was just published. I look forward to this one every year because it’s backed by a massive amount of data collection and analysis, it’s easy to read, it always throws at least one curve ball, and there’s a TON of useful information. This may be the most on point, useful research report published for leaders each year. At 144 pages, Rewriting the Rules for the Digital Age is not a quick read, but it’s a must read for every HR professional – regardless of the size of your organization. Whether you’re a department of one, a depart of 10, or a department of hundreds of thousands, the trends captured by Deloitte’s survey and discussions need to be on your radar. Period.

Each year the survey identifies the top 10 human capital trends that should be shaping organizational decision- and policy-making, investments, budgets and leadership behavior. This year they are:

Trend 1           The Organization of the Future:  Arriving Now

Trend 2           Careers and Learning:  Real Tim, All the Time

Trend 3           Talent Acquisition:  Enter the Cognitive Recruiter

Trend 4           The Employee Experience:  Culture, Engagement, and Beyond

Trend 5           Performance Management:  Play a Winning Hand

Trend 6           Leadership Disrupted:  Pushing the Boundaries

Trend 7           Digital HR:  Platforms, People, and Work

Trend 8           People Analytics:  Recalculating the Route

Trend 9           Diversity and Inclusion:  The Reality Gap

Trend 10         The Future of Work:  The Augmented Workforce

As you look at these trends, don’t you think to yourself, “you could write a whole book on each topic!”? Well, I did. But the good news is, after the introduction, there is a whole chapter on each trend with data, analysis, heat maps, graphs – all the goodies you’d expect.

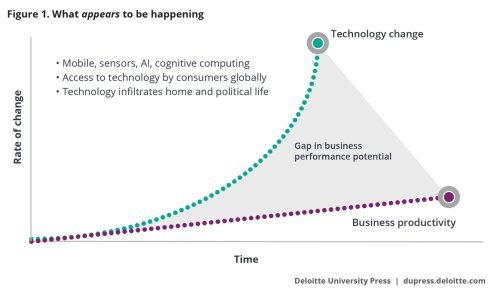
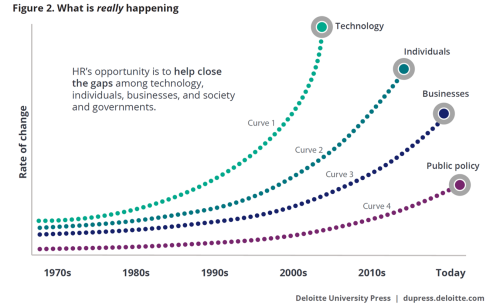
But here are two graphs from the Introduction, Rewriting the Rules for the Digital Age, that sets the context for everything that follows. If you’re like me, you’ll do a bit of a head smack when you see these and say to yourself, “Yep. That’s exactly how it’s working. Or not.”

deloitte-hcm-trends-2017-fig-1And,

deloitte-hcm-trends-2017-fig-2

These make so much sense and really underscore HR’s role in leading all organizational leaders to consider the broader context of what technology can – and must – mean in the coming years.

I don’t want to give away the store here, so I won’t share more of the research and conclusions. Read the trends analysis yourself. See how you would prioritize the 10 trends and make a plan. Time to roll up your sleeves! Remember that old saying, that the future is now? Well, in this context, it’s true.

2 Comments

Filed under Big Data and HR, China Gorman, Data Point Tuesday, Deloitte, Future of Work, Global Human Capital, HR Data, HR Trends, Human Capital, Workforce Management

Want To Improve Your Business Outcomes?

data-point-tuesday_500

Last week I wrote about the new Gallup report, State of the American Workplace, and discussed some of its broader findings. This week, we’ll dig in a little more specifically.

Two of the chapters, U.S. Workers: Increasingly Confident and Ready to Leave, and The Competitive Advantage of Engaging Employees, should be required reading for all leaders as well as HR folks.

Let’s look at the chapter on U.S. workers having one foot out the door first. According to Gallup, “51% of U.S. employees say they are actively looking for a new job or watching for openings.” Think about that for a minute. A little more than half of your employees have at least one foot out the door.

Optimism about the job market is up for good reason:  hiring is up. Gallup measures job creation and reports its Job Creation Index. In 2012 the Gallup Job Creation Index averaged +18. For the first three quarters of 2016, it averaged +32. So our employees have a deservedly high level of confidence that when they leave, they can find a good replacement job fairly quickly. It’s no wonder that many of our employees have a “grass is greener” outlook.

gallup-employees-are-leaving-2017

And, of course, all of these reasons tie into your HR strategies, policies and plans. Your approach to employee engagement should be tying in to these 5 reasons for employee resignations.

While there are many definitions for employee engagement, this really caught my eye in the report:

“Some leaders and managers believe the ultimate goal of employee engagement is higher levels of worker happiness and satisfaction. Happier workers certainly benefit an organization, but the real goal of employee engagement is improved business outcomes.”

Boom! Let me quote this again:  “…the real goal of employee engagement is improved business outcomes.” Every definition of employee engagement works here – as long as we understand the real outcome for which we’re working.

If employees are happier, they’ll work smarter and harder and quality will go up, improving our business outcomes.

If employees feel respected, they’ll be more committed and stay longer, improving our business outcomes.

If employees’ skills are developed, they’ll make greater contributions, improving our business outcomes.

If employees see a career path forward, they’ll be more committed and stay longer, improving our business outcomes.

If employees feel connected to the organization’s mission, they’ll spend more of their discretionary energy on the job, improving our business outcomes.

You get the point. As you’ll see in the chapter on The Competitive Advantage of Engaging Employees, employee engagement isn’t a nice-to-have any more. In this age of talent shortages and high turnover, employee engagement is a requirement to meet and exceed our business goals.

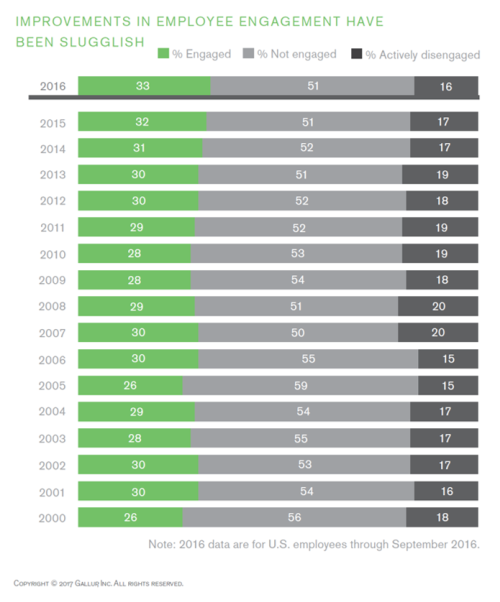
Gallup has been measuring employee engagement globally for a long time. In the U.S. the figures for the last 16 years are surprising. And not in a good way. They are actually alarming. Take a look:

gallup-engagement-2017-original

What’s alarming about this data is that, essentially, despite a ton of investment in programs, approaches, technology, and training, the employee engagement needle hasn’t moved since 2000. For all intents and purposes, despite our best (?) efforts, the percentage of the workforce that is either Not Engaged or Actively Disengaged hasn’t moved at all over the last 16 years. Somehow, despite our best efforts, we are not convincing our employees that we value them, that we need them, or that we want them. And they’re actively looking. Add in to the equation that there a lots of jobs available – and a lot of them are good jobs – and it’s easy to see why employees feel empowered to check out the green grass across the street or across the country.

Perhaps we aren’t speaking their language. Perhaps we aren’t letting them in as real partners in our drive for success. Perhaps we aren’t asking, or listening, or engaging. But it’s clear from this data – and a great many other sources – that the average organization needs to step up its employee engagement game.

The data are clear. Engaged employees – use definition you like – have lower turnover, lower absenteeism, higher customer metrics, higher productivity, higher sales, higher profitability – as I have been quoted saying, “everything we measure that we want to go up will go up, and everything we measure that we want to go down will down when we create a culture that values its humans.”

Download this report. Download it today and start considering how you can improve your business outcomes by engaging your employees.

4 Comments

Filed under China Gorman, Culture, Data Point Tuesday, Employee Engagement, Employee Productivity, Gallup, Happiness at Work, Talent Management, Workforce Management, Workplace Culture

The True Cost of On-Demand Talent

data point tuesday_500

WorkMarket has just published a new survey analysis, the 2016 Corporate On-Demand Talent Report. It’s got some really great information about “On-Demand” talent in our changing economy. And while a definition of “On-Demand” was never given, it’s clear that it means more than the traditional blue collar or retail “temp” definition. It clearly also includes professionals of all stripes who either prefer a more fluid and flexible on-demand employer-employee relationship, or who have been displaced and who can’t seem to find new, satisfying full-time employment.

Some interesting findings:

  • Nearly 17% — or 27 million workers – of the U.S, workforce is now part of the corporate on-demand economy

  • 88% of businesses are currently using an on-demand workforce

  • 46% of businesses are using on-demand labor for more than a year at a time

  • 42% of businesses are using the same professionals more than half the time

At 9 pages, the survey report is a quick and interesting read. The survey results are from an online survey of 1,037 adults that was fielded in November and December last year. The employers represented appear to be an appropriate cross-section in terms of revenue size and numbers of employees.

The results of this survey show an economy and workforce undergoing an even larger transition than we might have realized: more than 40% of businesses indicated their on-demand professionals comprised more than 30% of their overall workforce. WorkMarket suggests that employers are trying to shrink their fulltime workforces, with all the expenses and liabilities they entail, while trying to grow their businesses. This could mean a fundamental reshaping of the employer-employee relationship. Employers are considering how they can we grow their businesses while shrinking their commitment to their people, seems to be the message from this report.

This graphic is challenging for me:

WorkMarket 1

I guess my question is: what does flexibility mean? Does it mean having the ability to move people around when and where we need them? Does it mean being able to staff up and down during peaks and valleys? Or does flexibility mean being able to “rent” skills for as long as possible without calling the skills holders “headcount” and having to provide a full range of benefits? Is headcount a dirty word now?

Does lowering labor costs mean paying on-demand workers less than fulltime workers? Does lowering labor costs also mean not providing the full range of benefits to on-demand workers that similarly skilled and deployed full-time workers receive?

These findings are surprising to me because I’ve actually been noting a growth in the number of employers that are focusing on creating more human workplace cultures. Creating cultures that treat employees as full human beings, not just skills that clock in and clock out. The proliferation of data connecting better corporate performance with positive, employee-focused cultures seem to contradict these findings that suggest employers will go to great lengths to NOT hire full-time employees and be liable for them.

WorkMarket may have uncovered unintended consequences of the On-Demand economy. At least I hope they’re unintended. These survey results could turn our conversations away from the ever elusive quest for employee engagement to a more useful discussion about the changing nature of the employer-employee relationship in the U.S. If employers really do want skills flexibility more than they want a stable, reliable workforce to whom they are committed, we have only begun to experience the On-Demand economy.

1 Comment

Filed under China Gorman, Company Culture, Data Point Tuesday, On-Demand Economy, Workforce Management, Workforce Planning, WorkMarket

What Do You Know About the Hourly Workforce?

data point tuesday_500

Here’s an eye opener:

“As of 2014, hourly workers make up 56.7 percent of the United States workforce. Think about that for a moment. More than half of all people working the U.S. make an hourly wage. That’s 77.2 million workers aged 16 and up. Yet there is little data to be found about the hourly worker. The U.S. Census publishes a total number of hourly workers and breaks that number down by very broad age characteristics, full-time vs. private sector and race. But that’s all. The segment is so ignored that even the monthly unemployment report doesn’t categorize the workforce by salary vs hourly. The U.S. Department of Labor recognizes them only in an annual report on minimum wage workers. To understand the majority of laborers in the United States, we are left to guess.”

redeapp is changing this through the commission of a series surveys and reports from Edison Research. The first, Profile of The Hourly Worker: Demographics, Devices and Disconnection, crossed my desk right before the end of 2015. And it’s pretty interesting.

Redeapp provides private and secure communications platforms that connect companies with their hourly, front-line employees and those without company email access. So they have a vested interest in having a deep understanding of this segment of the workforce. What they’ve found, in some cases, seems counter-intuitive. Like this, for example:

Profile of Hourly Worker 1.png

If the data are to be believed, more than 30% of the U.S.’s hourly workforce has 1-3 years of college or more – with fully 24% having some graduate credits or an advanced degree! I would not have expected that 49% of our hourly worker population would have a 4-year college degree – or a high school degree and some college credits.

Another surprise: email is used by this segment of the workforce multiple times each day in their general work responsibilities. But here’s the rub: only 50% of this segment have an email address provided by their employer. And 42% report that they use their personal email account for work communication either sometimes or often. How many liabilities and risks can we count here?

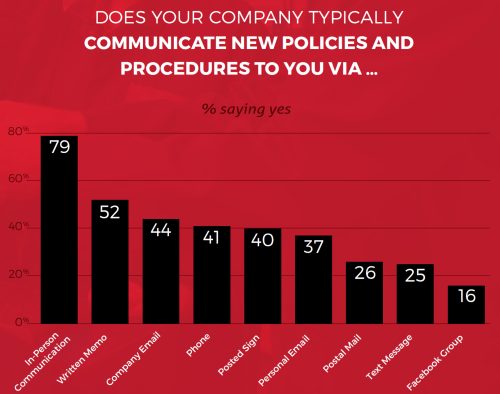
Given that scenario, this chart becomes very interesting:

Profile of Hourly Worker 2

The risk and control issues that exist in an un-secured corporate communication environment are quite large. Clearly, understanding hourly workers and how to communicate with them is a priority for organizations that employ this segment of the workforce. And perhaps, this segment of the workforce isn’t quite what you pictured.

Take a look at this survey report. It’ll make you think about your communication strategies. In a good way.

1 Comment

Filed under Big Data and HR, Bureau of Labor Statistics, China Gorman, Corporate Risk Management, Data Point Tuesday, Employee Demographics, Employee Loyalty, Hourly Workers, HR Analytics, HR Data, redeapp, Strategic Workforce Planning, Uncategorized, Workforce Management

Automated Workforce Planning: Tactical or Strategic?

Data Point Tuesday

An organization’s most critical assets are its employees. No one bothers to argue against that point any more. An organization’s workforce is also, however, its most expensive asset, and workforce management (the development of employees, retention of skilled talent, etc.) is consistently cited as one of the top issues facing organizations today. In a recent Aberdeen report, 60% of all organizations reported a need to improve workforce planning capabilities as a driver of their total workforce management efforts.

Pressures Driving TWM

Improving workforce planning capabilities took the top spot for pressures driving workforce management efforts, but better access to workforce data (in order to improve decision-making) was close behind, 60% vs. 52%. In our current “golden age of technology” there are ample workforce management technology solutions that can help organizations with workforce management, from timekeeping and leave of absence management to labor forecasting and analytics. The adoption of automated workforce management solutions though (as with other tech solutions) has been slow among organizations. Aside from the fact that the global workforce is rapidly driving towards a place where technology and automated workforce solutions will be a necessity for companies to remain innovative and successful, we have data that show – on a much simpler level – that workforce management technology is a good investment because it offers organizations multiple financial benefits.

Research shows that the use of automated time, attendance, and scheduling solutions results in 8% to 20% lower replacement costs (as a percentage of annual pay) for hourly workers, which can be attributed to the reduced cost of administration needed to manually manage such functions. Aberdeen’s research also found that average revenue per full time employee increased four times in organizations with automated absence/leave management technology and two times for organizations with automated scheduling, time, and attendance technology.

Automation Impact GraphOrganizations that automate scheduling, time/attendance and leave/absence management also saw increases in customer satisfaction levels ranging from 9.2% to 10.4% (compared to a 2.9% to 6.2% range of improvements for organizations that did not have automated solutions).

Automated workforce management solutions can also help to reduce unplanned overtime. While it’s expected of organizations to experience some overtime, having an inaccurate idea of what employees schedules will look like can quickly increase an organization’s spending. Best in class organizations experience less than 4% of unplanned overtime costs in comparison with 27% for laggard organizations. Automated solutions can help managers with critical scheduling accuracy, freeing them to give more time and attention to core business needs.

Unplanned-Overtime-Costs

Another benefit for organizations that use automated time and attendance software is greater workforce capacity utilization. These companies have employees who, on average, work at 12% more their capacity than those who rely on manual processes or spreadsheets (83% vs. 74%). Automated leave and absence management additionally helps to lower costs by accurately tracking employees’ time off, making sure PTO is recorded as it is taken (ensuring for example, that employees are not owed leave at the end of the year they’ve earned but not taken) and by providing organizations with software to properly submit and track leave and absence requests (mitigating the impact of planned/unplanned losses).

A May 2014 report by Aberdeen found that optimizing scheduling is a key attribute of leading firms. These firms experienced consecutive years of improvement in customer satisfaction by 17.8% compared to firms who did not have a focus on optimizing scheduling and actually lowered their customer satisfaction rates by an average of -3.9%. This should be the key take-away for organizations when it comes to automated workforce management solutions – we know that automated workforce management software can drastically help organizations to improve and optimize scheduling, and this is a key attribute of successful companies. And if the slow adoption of automated solutions comes from a concern that instituting such software could turn into a micro-managing nightmare, organizations should note that, as with all tools, its about how you introduce them and support their adoption. The potential benefits of automated solutions far out-way any cons, so dipping a foot in the automated solutions pool seems well worth the risk, even if it may require an investment in training and change management. We’re already witnessing the expansion of HR and administrative roles within organizations; these functions are providing organizations with instrumentally more strategic value than they have in the past. Free up these departments time and energy from consuming workforce management tasks like monitoring attendance/leave and scheduling, and see what happens when tactical, manual roles become automated and enable more strategic data analysis and insight to enter the mix!

2 Comments

Filed under #HRTechTrends, Aberdeen Group, China Gorman, Data Point Tuesday, Workforce Management, Workforce Planning, Workplace Studies

The Tip of the Engagement Spear

data point tuesday_500

BlessingWhite’s Employee Engagement Research Update has recently been released.  It’s an update to their massive research published in 2011. Measuring engagement is tricky – from gaining consensus on terms and definitions, to crafting survey questions that generate useful answers, to identifying key findings, to agreeing on recommendations – it’s all very tricky.

BlessingWhite does a good job managing the trickiness.  But truthfully, there’s not a lot of difference in engagement scores globally since their 2011 findings.

Here’s what caught my attention, though, as it did 2 years ago, as I read through the report:  a greater percentage of the workforce trust their managers more than they trust the executives in their organizations.

This makes sense, right? Managers have day-to-day interaction with their colleagues and can get to know them in personal ways. Executives, on the other hand, rarely have one-to-one interaction with the majority of the employees their organization. And the survey results show the difference in trust levels.

I trust my manager BW 2013

I trust senior leaders BW 2013

It’s a good thing that employees in North America trust their managers more than they trust their senior leaders because there’s a high correlation between engagement and trust in managers. Or maybe it’s the other way around.  Either way, BlessingWhite points out that while engaged employees have other factors that motivate them – like interesting work, a sense of contribution and career aspirations – less-engaged employees are far more dependent on knowing their manager personally to reach higher levels of engagement.

This makes managers the tip of the engagement spear. And why we spend so much time focused on managerial effectiveness in almost every category of performance.

Not so with senior leaders, which is understandable because they don’t have the ability to interact personally with every employee, as BlessingWhite points out.  But they do have the responsibility to set the direction of the culture, communicate that direction with a “clear line-of-sight” throughout the organization, and create a culture that fuels engagement and business results. In other words, set the managers up for success in engaging their teams in more personal ways.

The CASE model, reviewed briefly at the end of the report, focuses senior leaders to fulfill four key workforce needs in building and leading their cultures:

  • Community for a sense of belonging and purpose
  • Authenticity  as a basis for trust and inspiration
  • Significance to recognize individuals’ contributions
  • Excitement to constantly encourage – and raise the bar on – high performance

It’s a good message for executives. It’s a great message for managers. It’s a call-to-action message for HR to know how to help executives drive performance and grow their culture while supporting managers to make more personal connections.

Engagement isn’t the answer to every organizational challenge. But it does seem clear that highly engaged workplaces are more productive than less engaged workforces. And almost every organizational challenge I can think of gets solved more effectively and faster with an engaged workforce working the solution and being led by managers who are personally leading the way.

8 Comments

Filed under BlessingWhite, China Gorman, Connecting Dots, Data Point Tuesday, Engagement, HR Data, Managerial Effectiveness, Workforce Management

Getting leave management wrong has consequences — and they aren’t what you think!

Leave management is one of those tactical HR functions that we’re required by law to get right.  With more than 300 state, local and federal laws/regulations with which to comply, U.S. employers have to stay on top of an ever-changing morass of guidelines that impact their employees in very personal ways.  It’s not just about vacation or PTO.

Workforce Management has published trend survey data on this topic and even though the subject of tracking employee time off is pretty tedious, the issues surrounding it are business critical.  The 2011 trend survey, published in early 2012 and sponsored by WorkForce Software, is amazingly interesting. I know, surprising, right?

For example, unless you’re the one responsible for ensuring compliance with all applicable laws/regulations, did you know that 40% of employers report an error rate of 3 or more unearned leave days per 100 employees per pay period? That’s pretty big from a payroll expense perspective.  And what do you do when you find out? Clawback the unearned time? And how do you do that? Take time out of next year’s leave pool? Ouch.

That’s why I found it really interesting that when the survey asked employers what the greatest negative impact of non-compliance was, Employee Morale was far and away the biggest impact. Regardless of the employer’s size.

Here’s why this makes sense to me:  I learned early in my leadership career that you have to get employees’ compensation right. You have to pay them the right amount; you have to pay them on time; and you have to manage their time off accurately. You can’t screw up any of these and not impact morale. And if you screw up any or all of these up more than once you’re sunk.

And so it really isn’t surprising that more than litigation fines/costs and brand equity/reputation, employee morale is HR’s biggest concern in ensuring compliance in managing time off. I don’t think this concern is driven by the old “touchy-feely” rap that HR used to get. This is cold, hard reasoning about the cost to the engagement and retention of employees if the organization can’t get the basic building blocks of paying people correctly right.

So reducing the error rate isn’t just about reducing payroll dollar mistakes, it’s about productivity and morale. There’s more interesting data in this report. You can download it here.

1 Comment

Filed under China Gorman, Connecting Dots, Engagement, HR Data, Leave Management, PTO, Talent Management, Workforce Management, WorkForce Software