Tag Archives: Compensation

Compensation Transparency

Ben Eubanks over at Lighthouse Research and Advisory has written a fascinating white paper on transparency. Transparency in Compensation:  Trends and Best Practices, underwritten by salary.com, is a thoughtful and interesting discussion of the impact of different levels of transparency in the workplace – from too little to too much. It presents an interesting model and some terrific takeaways.

If you’re struggling with – or merely thinking about – how much salary information you should be sharing, this discussion could be very helpful. The following model might be helpful in identifying the pressure points with which you may be dealing:

Of course, your organization values may be a driver as well. More and more organizations are committing to greater transparency as a cultural imperative as well as a competitive differentiator.

The report also provides a process framework to follow as you consider making changes in your level of compensation openness:

This framework is simple and contains the most important advice in the report:  “Remember, default to transparency unless there’s a compelling reason not to.”

Conversations around transparency are important. As we move away from the cultural norms managed by the Baby Boomers, values like transparency are beginning to take hold. As a Baby Boomer myself, I particularly favor this development. Being more forthcoming with our employees – and not just on compensation practices – will help us win the War for Talent.

6 Comments

Filed under Ben Eubanks, China Gorman, Compensation, Data Point Tuesday, Lighthouse Research and Advisory, salary.com, transparency

Culture and Compensation

PayScale has produced its 8th annual in-depth report on compensation best practices: Comp is Culture. If you have anything to do with paying people – so, that’s virtually every manager, everywhere – reading this report will be well worth your time. Even though I’m not an HR professional, much less a compensation professional, I found it fascinating. Especially the impact that compensation practices have on organization culture.

The report is based on responses gathered in November and December, 2016 from 7,700 respondents, of which 5,136 were in the U.S. and 641 in Canada (as well as respondents in Australia, India, South Africa, the United Kingdom, and others);12% were Enterprise organizations’ (5,000+) employees, 13% Large organizations’ (750-4,999) employees, 29% Mid-sized organizations’ (100 – 749) employees, and 46% Small organizations’(1-99) employees.

Not surprisingly, the report identifies the following ass the biggest talent- and culture-related challenges in 2017:

  • Finding and growing great talent
  • Employee retention/engagement – large number of retirements anticipated in 2017 as well as continued millennial job-hopping
  • Competition from younger stage tech startups
  • Hiring and retaining the right employees in the face of high growth
  • The fierce talent competition shifting the balance of power to candidates
  • Improving company culture and fighting attrition for newly trained employees

The picture here is clear:  the war for talent hasn’t abated. In fact, in may just be beginning in earnest.

As it relates to pay practices and culture, the PayScale research found the following:

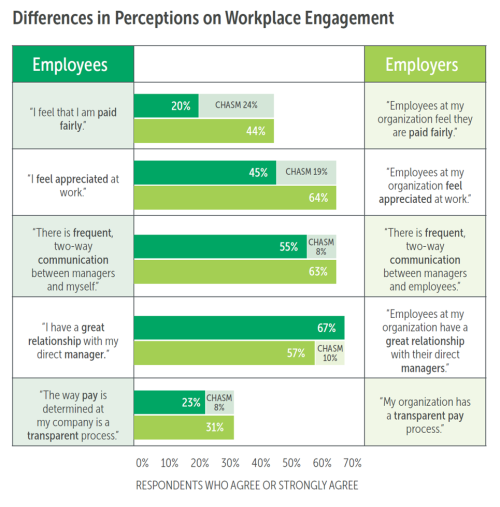
  • When it comes to pay, only 20 percent of employees said they were paid fairly, whereas 44 percent of employers said that their employees were fairly paid.
  • In a similar vein, employers were significantly more inclined to say their employees were appreciated at work (64 percent), whereas only 45 percent of employees said they felt appreciated at work.
  • A question around pay transparency revealed more of the same – 31 percent of employers said their company had a transparent pay policy, whereas only 23 percent of employees agreed.

There are a number of discussions and supporting graphs to keep even the most nerdy among us engaged, but these discussions and graphs are also easily understood and the information flows simply and logically. There’s a lot here, and it’s all good.

Being focused on all things relating to organization culture and leadership’s impact on it, I found the following chart very interesting:

There are two points here that are worth pondering if you think the data might apply to your organization:

  1. The percentage of respondents in both the employees and employers categories who agree or strongly agree on all five statements is higher than might be expected, with the exception of the final statement.
  2. Only one statement has a higher percentage of agreement from employees than from employers – and it’s the statement about the state of the employer/employee relationship. Employees report that their relationship with their manager is stronger than the managers report. With rising turnover and many organizations struggling to increase retention, who saw that coming?

This report covers the waterfront in terms of compensation practices, their impact on culture, and employees’ perception of many of the aspects of their pay. There are a number of surprising nuggets of information that could impact your organization’s compenation practices. It’s not an easy read, but it’s a good read. I recommend you spend some time with it.


1 Comment

Filed under China Gorman, Compensation, Culture, Data Point Tuesday, Employee Experience, Employee Satisfaction, HR, HR Data, PayScale, Performance Management

Tech Professionals’ Pay by the Numbers

data point tuesday_500

Dice, the career site for technology and engineering professionals, published their annual Tech Salary Survey in January. And as Chairman, President & CEO of Dice Holdings, Inc., Scot Melland observed, “The fact is you either pay to recruit or pay to retain and these days, at least for technology teams, companies are doing both.” The constant being pay.

According to the responses of 15,049 employed technology professionals between September 24 and November 16, 2012, tech professionals have garnered the biggest pay raise in a decade. The survey report is highly consumable and I recommend it to anyone involved with hiring or managing technology professionals.

The contents include:

  • 10-year trend in tech salaries
  • Salary by employment type
  • Bonus trends
  • Salary by metro and region
  • Tech employee motivators
  • Tech salary satisfaction
  • Salary by industry
  • Salary for high paying skills
  • Average salary by experience and education level

The last section, average salary by experience level, is eye popping. Check it out.

Dice Tech Salary Survey Education Level Salaries 2013-2012

First of all, we can tell by these salaries that STEM education pays off from a career opportunity perspective.

Second, we can tell by these salaries that the market perceives low supply.

Third, look at the high school graduates’ salary vs. vocational/tech school and some college salaries. What’s up with that?

Fourth, the year-over-year change in the salaries of military veterans vs. every other category is head snapping.

Let’s look at these observations.  First, I think we can all agree that there’s no downside to focusing on STEM education. No downside for employers who perceive low supply and no downside for employees whose lifetime earnings are among the highest.

Second, supply vs. demand economic principles seem firmly in charge of these salary trends. We can debate whether or not there truly are skills shortages in the marketplace today. But it seems clear that the market believes there is a shortage and is paying accordingly.

Third, as we consider the counter-intuitive data showing high school graduates earning significantly more on average than votech grads and some college/associates’ degree holders, we might be seeing generational effects coming in to play. More recent high school graduates may have more current hardware and programming learning than those who attended the votech programs of the 1970’s, 1980’s and 1990’s.  Certainly with the ability to connect to communities of interest via the social web, today’s high school students have a leg up on learning that their parents never had. Additionally, while employers aren’t spending the money they used to on internal training, technical training programs continue to be present.

Fourth, it appears that military veterans with current technology skills can enter the market at higher levels and command higher salaries. And I think we’d all agree that this is a very good thing.

This is a very useful snapshot of the salary landscape for a portion of our employees. Wouldn’t it be interesting to see the same data for other functional skillset areas? Like marketing, finance, or even HR?

Leave a comment

Filed under Average Wage, China Gorman, Compensation, Data Point Tuesday, Dice, Skills Shortage, STEM, Technology Salaries

Connecting Dots: Employee-style

data point tuesday_500

Back in July, I referenced data from the Glassdoor Q2 2012 Employment Confidence Survey.  If you’ll recall, this quarterly survey monitors four key indicators of employee confidence:  job security, company outlook, salary expectations and re-hire probability.  The Q4 2012 Survey from Glassdoor is out and the results are interesting.

It’s probably not shocking to anyone who reads this blog that half (51%) of employees (including self-employed people) will consider looking for a new Glassdoor logojob if the state of the economy stays the same or improves, with 33% looking for a new job in less than a year and nearly one in five (18%) planning to look for a new job in the next three months.  We’re hearing that our employee base is not engaged and other sources have said that as much as 90% of the employed population will look for a new job in 2013.

Glassdoor ECS Q412 - consider looking for a new job

What’s interesting to me is that, if you look at other data points in this survey, it makes perfect sense that a high percentage of employees think they’ll look for work this year. Why?  Well, according to the survey, 39% of employees don’t expect a pay or cost-of-living increase in 2013 and 21% aren’t sure if they’ll get an increase this year.

Glassdoor ECS Q412 - salary-expectations (2)

So.  60% of employees don’t think – or aren’t sure – they’ll get an increase this year.  I’m thinking that has something to do with the percentage of employees who will be looking for a new job this year.  And guess what?  The most important factor these employees say that will influence their decision on whether or not to accept a job offer is…wait for it…salary and compensation!

Employees are pretty good at connecting dots:

I don’t think I’m going to get a raise this year   +

I’ll be looking for a new job this year  =

The most important factor in my decision to accept a new job will be the salary and compensation

Makes perfect sense to me.

But I also think that a majority of employees will receive raises of some sort this year.  Even small ones.  So why do so many think that there is no soup for them?

Perhaps we’re causing this supposed exodus ourselves by not communicating clearly – at the employee level – what our compensations plans for this year are.  Or, maybe we’re being extremely clear and they don’t believe us.

Either way, it’s a problem.  Either way, we should never forget that our employees are smart and know how to connect the dots.

Maybe it’s time we do the same.

2 Comments

Filed under China Gorman, Compensation, Connecting Dots, Employee Loyalty, Engagement, Glassdoor, HR Data