Working Parents Feel More – Not Less – Stress

Data Point Tuesday
Bright Horizons
recently conducted a national study, “The Modern Family Index” that explores what it means to be a working parent today. The study revealed some insightful points, including that working parents still perceive that their responsibilities with their family may cause them to experience significant challenges at work. Bright Horizon’s research highlights that much has changed towards how parents approach family obligations and the level of conflict they experience. But how positive are those changes when, overall, many employees still feel like they can’t be honest with their supervisors about family responsibilities?

Perhaps the most obvious example of change toward family obligations in 2014 is that work/family balance is not only an issue for mothers. Fathers report being nearly just as stressed and insecure about work and family conflicts as mothers (46% of dads say that one of their daily stressors is child care needs during the workday, vs. 52% of moms) and are likely to be just as nervous as women to tell their bosses about some of their big family commitments (63% of men vs. 68% of women). Additionally, for fathers, work/life integration ranks just as highly as other top stressors like saving for retirement and managing personal health. Additionally, telling their bosses that they need to take time off for a family matter is just as stressful (39%) as telling a boss they’ve made a mistake on a work project (36%). When it comes to flexible scheduling, one in three fathers (34%) report asking their employers for more flexibility or modification of their work schedule to meet obligations to their children (compared to 42% of moms).

While the increased balance of family obligations between men and women represents a positive trend, it’s still concerning that working parents so highly perceive that family obligations can negatively impact their career – or actually cause them to be demoted and fired. Bright Horizons Family Means Fired
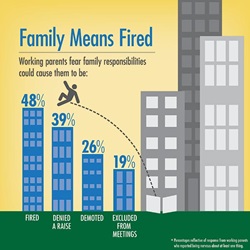
reports that 60% of working parents have at least one work-related concern caused by family responsibilities, and 48% admit one of their concerns due to their family responsibilities is that they could get fired! If there’s any statistic to highlight in this report, I think it’s probably this one: nearly 50% of working parents are concerned about getting fired for having family obligations! Additionally worrisome data follow this statistic, including:

  • 39% of parents fear being denied a raise because of family responsibilities
  • 37% fear they will never get promoted again, and
  • 26% worry about a demotion because of family responsibilities.

And to make sure family obligations don’t impact work time? Parents report spending 51% of paid time off dealing with family responsibilities instead of taking a trip or relaxing at home.

Bright Horizon’s research unfortunately pulls the rug out from under the belief that discussions of work/life integration and family obligations are commonplace today. Certainly they are more common than they were in the past, but this study indicates that we might not be taking the leaps and bounds that all the headlines around work/life integration suggest. Employees today remain just as nervous bringing up key family-related issues (51%) as important work-related problems (52%) with employers, and 23% of working parents (almost a quarter) admit to lying or bending the truth to their boss about family responsibilities that get in the way of work:

  • 31% of working parents have faked being sick to meet family obligations
  • 39% admit that one of the things they would be nervous to tell their boss is that they need to miss a work event for a family commitment
  • 56% (more than half!) of working parents report that one of the topics they would hesitate to ask their boss about is reducing hours, working remotely or placing boundaries on responding to calls or emails.

This would be a good time to consider what work/life integration programs your organization offers – as well as the attitude senior management has towards employees with families. Does senior management walk the talk or are family friendly policies just lip service? Make sure working parents are aware of programs that are in place to help them balance their work and family responsibilities, and, perhaps more importantly, make sure it is emphasized that it is OKAY, and expected, that working parents utilize those programs. Creating family friendly policies in one thing. Encouraging their use and ensuring that parents’ careers are not jeopardized for using them is an entirely other thing. Where does your organization net out?

1 Comment

Filed under Bright Horizons, China Gorman, Data Point Tuesday, Work Life Balance, Work/Life Integration

#GenMobile: State of Mind Not Function of Age

Data Point Tuesday

We’re at a turning point with mobile technology. For many users, tablets and smartphones are no longer a convenience or entertainment tool, but a necessary part of their working lives. A recent survey by Aruba Networks identifies these users as “generation mobile.” The research, conducted to take stock of mobility’s increasing prominence in people’s working lives, examines survey responses from over 5,000 members of the public across the USA, UK, France, Spain, Germany, Sweden, South Africa, Saudi Arabia and UAE. Several characteristics define “generation mobile,” including believing in working anytime and anywhere, and in a more connected world (from cars to clothing). And while 18-35 year olds do account for the highest mobile users, generation mobile spans all age groups.

Aruba Network’s research found that 86% of respondents owned at least two connected devices (devices with the ability to connect to the internet). Non-traditional working hours and the option of flextime were also identified as highly important values to generation mobile people. It should be noted though, that while the ability to hop on Wi-Fi and access work related materials during non-traditional work hours appeal to gen mobile, this value is not driven by laziness (45% of respondents report that they work most efficiently before 9am and after 6pm). Additionally, over half of those surveyed said they’d prefer to work from home or remotely two to three days a week than receive a 10% higher salary. This indicates that instituting flexible scheduling could not only increase productivity for employees and create a happier culture, but could be an opportunity for companies to create cost savings. Across the globe we see this move towards flexible work arrangements being reflected, with working out of office on the rise, and 37% of respondents expecting this trend to continue (with just 4.5% foreseeing a decrease).Types of Tech

How vital is your mobility? 64% of respondents report that their mobile devices make them more productive at work, and 63% (over two-thirds) think their mobile devices help them manage their lives better. Looking just at hours spent, mobile devices play a huge role in people’s daily lives: 1/3 of us spend over 1/3 of our day on these devices, and while people still value ‘disconnected’ time (63%), such devices are obviously valuable to us – I’d wager you’ve felt the sting of forgetting one of these devices before. Why, as an organization, is it important to recognize the expectations and values of this generation mobile group? Despite the fact that this group is only likely to get bigger as we continue along in this uber-connected world, as I’ve discussed in other posts, understanding the values and motivators of your employees – and conveying that you value these too, is a huge part of building a great place to work.

Employers should know that 28.9% (over a quarter of those surveyed in Aruba Network’s research), feel it is their company’s responsibility to provide them with a smartphone or a tablet. Furthermore, 29.2% report that though they would rather buy their own, they see these devices as a workplace necessity. It’s also important to note that the overwhelming majority of respondents want Wi-Fi over wired connectivity. This raises though, an important concern for employers. Organizations should make sure networks are secure and that the correct security measures are in place for employees storing company information on mobile devices.

How #genmobile is your workforce? In the quest to retain talent, do you account for these kinds of expectations? Have you spent any time thinking about how important mobile devices are to you and those around you – a little? a lot? And have you used this insight to avoid the assumption that mobile devices and the high mobility they provide are only valued by younger, millennial employees?

Turns out #GenMobile is a state of mind, not a function of age.

2 Comments

Filed under Aruba Netoworks, China Gorman, Data Point Tuesday, Mobile Devices, Work Life Balance, Workflex

I’m Not Crazy: Let’s Talk About Paternity Leave!

Data Point Tuesday

Perhaps it was the Father’s day celebrations that happened a few weeks back that sparked this week’s blog topic… a subject that stills seems rarely addressed: paternity leave, and workplace policies for new fathers. On the flip side, there are oodles of studies and piles of data on maternity leave and programs/policies for new mothers. While traditional social roles are still very influential and probably the biggest underlying factor for such discrepancies, at a time when working mothers are just as common as working fathers and gender equity is not something to strive for but a necessity in a great workplace, we owe it to ourselves to discuss paternity leave in the same light, and with the same vigor, as maternity leave. A 2014 study by the Boston College Center for Work and Family “THE NEW DAD: Take Your Leave” provides great perspectives on paternity policies at leading organizations, as well as an insightful global look at policies for fathers, incorporating interviews and surveys taken by ~3,000 dads.

When it comes to paid leave for time off directly following the birth of a child (for both women and men), the U.S is an outlier compared to nearly every other developed country in the world, offering no national policy on paid leave. In terms of paternity leave specifically, today there are 70 countries that offer paid leave in either the form of shared parental leave or paternity leave. It was perhaps most interesting to see father’s attitudes towards childcare and paternity leave. The vast majority of fathers surveyed rated their children as their top priority in life, more than 3 out of 4 fathers wished to spend more time with their children than they do presently, and more than 2 out of 3 fathers said caregiving should be a 50/50 proposition and wished to divide this evenly between spouses. When respondents were asked, in considering a new job, how important paid paternity/parental leave was in the U.S 89% indicated it was important, and more than half 60% indicated it was very important. The intensity of responses varied by generation, 93% of fathers from the millennial generation said paternity leave is extremely, very or somewhat important, Gen X fathers felt similar (slightly subdued at 88%) and Boomers felt least strongly (77%) – perhaps for obvious reasons.

The average amount of time off taken by fathers following the birth of a child is two weeks. Boston College’s study found, however, that there is a strong correlation between the supportiveness of the workplace culture and the number of weeks that fathers took off. The more encouraged new fathers were to spend time with their children, the more weeks they took off (on average). Whether leave was paid or unpaid was another big influencer on whether leave was taken. 86% of respondents said they would not make use of paternity leave or parental leave unless at least 70% of their salaries were paid, and 45% said compensation needed to be at 100%. When asked what the right amount of paternity leave/paternal leave should be in the U.S, 74% of fathers said 3-4 weeks.

Study by Boston College Center for Work and Family “THE NEW DAD: Take Your Leave”

The data clearly reflect the changing role of fathers and the expectation for men to be more involved with their children. Beyond this though, it may indicate that men have a strong desire to be more active parents, something organizations should encourage, for a number of reasons. More and more studies are acknowledging the importance of father/infant interaction. A recent paper in the Journal of Child Psychology and Psychiatry shows a correlation between behavioral disorders (the most common psychological problem affecting children) to disengaged interactions of fathers with their infants. A 2010 study cited in the Boston College report found that developing bonds with children at an early age improves the likelihood of a stronger relationship later in life. Additionally, global research has demonstrated benefits to families when fathers take paternity leave, including increased wellbeing for the new mothers. A recent study in the Journal of Business and Psychology Organizations found that men switch between four images of themselves as fathers: provider, role model, partner and nurturer and that depending on their work environment, one of these roles is always dominant. Men that work in an environment where they can talk about their children, for example, are more likely to be nurturers, whereas men who feel unable to discuss anything but breadwinning are likely to conform mostly to that role.

Organizations offering paternity leave are sending clear messages about work life integration and its values. While U.S. employers are not required by law to provide paid maternity or paternity leave, the positive impacts of these on building a culture of high trust are inescapable. As are the positive impacts on fathers, mothers and children. It gets increasingly difficult to argue against creating these kinds of policies.

Leave a comment

Filed under China Gorman, Data Point Tuesday, Employee Benefits, Paid Leave, Time off, Trust, Work Life Balance

Employee Wellness: It’s All About Control

data point tuesday_500

June is National Employee Wellness Month, so let’s focus on some current workplace health and wellness stats. We know that a workplace culture based on Trust creates happier, engaged and higher preforming employees on all levels. And health and well-being should be considered an important factor towards this overall goal because employees who experience poor health and wellness are likely to (amongst other things) experience higher levels of stress, miss more days of work and experience less productivity – all important determinants in an employee’s overall engagement. With Employee Wellness Month in mind, let’s celebrate the health and wellness of those around us, and consider the wellness initiatives at our own organizations – are there programs in place? Do they work? Do employees know about them?

In “The 2014 Consumer Health Mindset StudyAon Hewitt has partnered with The National Business Group on Health (The Business Group) and The Futures Company to explore the “perspectives, attitudes and behaviors that employees and dependents hold toward health and health care as they interact with their employer-sponsored health plans and wellness programs”. When it came to respondents’ perceptions of personal health, there were some interesting takeaways, including that overall, from 2012-2013, the amount of people reporting that their “health is at least good” has slightly increased (from 87% in 2012 to 92% in 2013). However, respondents continue to fail to consider their weight when accounting for their overall health; with 59% of those reporting being in “at least good health” considered medically to be overweight or obese, up from 53%.

Wellness programs graphic

As far as actions that lead to good health, respondents ranked the most influential factor as “making smart healthy choices in my daily life”, which ranked over factors such as “getting regular preventive care,” “living and or/working in a healthy environment,” “having good genes,” and “having enough money to pay for all the care I need to stay healthy.” Those employees who do work in strong cultures of wellness, however, were more likely to say that they had control over their health. Additionally, related to culture at work, respondents ranked “work environment” as the 3rd biggest obstacle that kept them from getting and staying healthy (lack of time at 63%, affordability at 40%, work environment at 35%). When looking at health care costs over the last decade it comes as no surprise that affordability ranks amongst the biggest concerns for maintaining health – employees’ share of health care costs will have increased 125% from 2004 ($2,011) to 2013 ($4,542).

Interestingly, only 12% of respondents see health information from their employer as significantly influencing their actions (but this number is up 50% from 2012). This is interesting considering that we have seen a significant increase of companies instituting health and wellness programs as a whole; are these programs in place but just not being used? Are employees not interested in the types of wellness programs being offered? Aon Hewitt’s study states that 19% of respondents feel their employers encourage healthy behavior between a 0-3 range (on a 10 point scale), whereas 47% believe their employers encouragement of healthy behavior falls between a 4-7 point ranges. Given this, it seems less likely that companies don’t have any programs in place at all, and more likely that they are either programs employees aren’t interested in, or aren’t aware of.

So how can companies encourage employees to take advantage of health and wellness programs? Respondents indicated that two of the biggest influencers of feeling like their organization had a strong health-related culture were: that their employer seriously considers all actions that improve employee health, and that employees were actively encouraged to incorporate healthy activities during the work day. Additionally, employees want programs that they can personally relate to. 46% of respondents stated they would not participate in a wellness program that is not relevant to them or does not apply to their situation (the number one reason). Additionally, in terms of what makes wellness programs most appealing, financial rewards (even small sums like $50 or less) takes the top spot, followed by programs being easy to do or convenient. Lastly, remember that respondents perceive making independent “smart healthy choices in my daily life,” to be the biggest overall influencer on their health and wellness. With this in mind, perhaps the most successful workplace wellness programs are the simple things put in place to encourage employees to make these choices – sometimes it’s the little things. Happy National Employee Wellness Month!

Leave a comment

Filed under Data Point Tuesday, Uncategorized

Core Employee Needs: Not All or Nothing!

data point tuesday_500

It seems as though we are consistently seeing data that show decreasing levels of employee engagement and feelings of fulfillment at work. This data can be, and has been, attributed to many factors, such as a lean post-recession workforce, an increasingly competitive talent landscape, and the uber-connected, uber-informed and uber-on business world in which we operate. I’d agree that all of these can create barriers to an engaged workforce, or challenge an already highly engaged workforce. There’s also data indicating (as I discussed in my post on what Millennials look for in a great workplace) that high amounts of stress, feelings of low-engagement or no work/life balance are not as significant as we may think. There are, on a positive note, data that suggest workplaces are doing much to negate issues of engagement and work/life balance, but much of this research comes from companies classified as “Best Workplaces” and considering the frequency of content reporting low levels of engagement, trust, and happiness, such companies may be few and far between. Ultimately, we can only take data at face value. The real importance of looking at such workplace statistics is to inform ourselves and build our “bigger picture” – know what’s out there, know what’s conflicting, and create solutions and approaches that are right for our own people, culture and strategic goals.

Some data I recently found interesting comes from an article published in The New York Times, “Why You Hate Work” which included research from The Energy Project, an organization that aims to increase employee engagement and sustainable performance for organizations and their leaders. The article, by The Energy Company’s CEO Tony Schwartz and consultant Christine Porath, discusses how “the way we’re working isn’t working” and that it’s increasing common for both middle managers and top executives to feel overwhelmed and disengaged. In an effort to understand what’s impacting people’s engagement and productivity at work, The Energy Project partnered with The Harvard Business Review to survey 12,000 + mostly white-collar employees across a range of industries and organizations. They found that employees are considerably more productive and engaged when they have the opportunity to: regularly renew and recharge at work, feel valued and appreciated for their contributions, focus in an absorbed way on their most important tasks, define when and where they get their work done, do more of what they do best and enjoy most, as well as feeling connected to a higher purpose at work. The study attributed these four areas to four core needs: physical, emotional, mental, and spiritual.

Energy ProjectIn terms of the core physical need at work, The Energy Project’s study determined that employees who take breaks every 90 minutes find themselves with a 30 percent higher level of focus than those who take one or no breaks during the day. These employees also report a 50% greater capacity to think creatively and a 46% higher level of health and well-being. Also interesting, is that when employees feel encouraged by their supervisor to take breaks, their likelihood to stay with any given company increases by nearly 100%.  For the core emotional need, feeling cared for by one’s supervisor has the biggest impact. Employees who noted having more supportive supervisors were 67% more engaged. The core mental need? Respondents that were able to focus on one task at a time reported being 50% more engaged (although only 20% of respondents reported being able to do this). Comparably, just 1/3 of respondents reported being able to effectively prioritize their tasks, but those who did were 1.6 times better able to focus on one thing at a time. In regards to the core spiritual need, the Energy Project’s research found that employees who derive meaning and significance from their work reported 1.7 times higher job satisfaction and were 1.4 times more engaged at work.  In a nutshell, this data show that how employees feel at work has a huge impact on their engagement and productivity.

One last valuable nugget of data to note from this study is that when employees have even just one of the core needs discussed above met, versus none, all variables of their performance improve (from engagement, to loyalty, job satisfaction, positive energy at work, and lower perceived levels of stress). This is good incentive for organizations to work on things one step at a time. It clearly isn’t an all or nothing proposition. Positive changes in employee engagement don’t necessarily happen from massive culture changes or vast implementation of new programs. Baby steps are okay folks; and the more core needs are met, the more positive the impact!

1 Comment

Filed under Career Planning, Center on Education and the Workforce, Millennials, Talentism, Uncategorized, Workplace Strategies

Memo to Women in Corporate America: Pick One – Mother or Leader

Data Point Tuesday
SHRM
and the Families and Work Institute have recently released their 2014 National Study of Employers (NSE), which identifies changes in the workplace since 2008. The report sample includes 1,051 employers with 50 or more employees, with 67% of these organizations for-profit employers and 33% are nonprofit organizations. 39% operate at only one location, while 61% percent have operations at more than one location. A pretty big sample. And the trends are interesting. Some make sense. And some, well, not so much.

Workplace flexibility is top of mind for many business leaders, and the 2014 National Study of Employers notes two major trends between 2008 and 2014 related to this. First, employers have continued to increase the amount of options that allow at least some employees to better manage the times and places in which they work, including occasional flex place (from 50% to 67%); control over breaks (84% to 92%); control over overtime hours (27% to 45%) and time off during the workday when important needs arise (73% to 82%). Second, employers have reduced the amount of programs that give employees the opportunity to spend significant amounts of time away from full-time work. These include sharing jobs (29% to 18%), working part year on an annual basis (27% to 18%), and flex career options like sabbaticals (38% to 28%) and career breaks for personal or family responsibilities (from 64% to 52%). So, yes to more control over place and time while working and no to opportunities to not work.
SHRM Flexibility Chart
A continuing trend from 2008 to 2014 is “12 weeks of leave.” No doubt based on the FMLA, this is usually given for the birth of a child, adoption of a child, or serious family illness. 12 weeks has become the norm, with more employers offering this amount of time since 2008. Currently, 93% of employers offer women 12 weeks of leave after giving birth (85% in 2008), 89% of employers offer employees 12 weeks after the adoption of a child (81% in 2008), and 90% of employers offer employees 12 weeks leave to care for seriously ill family (84% in 2008). Despite these increases, it’s disappointing to note that the maximum length of caregiving leaves offered to new fathers, new adoptive parents, and employees caring for seriously ill family members, as well as disability pay, has declined since 2008. Additionally, support from employers in areas like diversity and inclusion is declining, with fewer employers training supervisors in managing employees of different ages (59% in 2008 and 52% in 2014) and fewer employers providing career counseling programs or management/leadership programs for women (12% in 2014 vs. 16% in 2008). Also along this line, fewer employers report that supervisors are encouraged to assess employee performance by what they accomplish vs. by just “face-time” (71% in 2008 and 64% in 2014). So yes to new birth mothers and no to just about everything else. Hmmm…

What support programs then, are workplaces increasing for employees? Employers are increasingly helping employees with elder care, with employers in 2014 12% more likely to report that they offer Elder Care Resource and Referral than employers in 2008. Employers are also 18% more likely in 2014 than 2008 to offer DCAPs (Dependent Care Assistance Programs) for elder care and 4% more likely to offer access to respite care. Wellness programs are also increasing, with 60% of workplaces providing wellness programs today (compared to 51% in 2008). SHRM and the Families and Work Institute’s report also noted an increase in the amount of workplaces providing Employee Assistance Programs to help with personal/family problems and pressures (78% now, compared with 58% in 2008). When it comes to healthcare, 98% of employers provide personal health insurance for full-time employees, a 3% increase from 2008. Additionally, there has been a 6% increase in employers providing more health care coverage for family members of full-time employees from 2008 to 2014 (91% to 97%), and a huge increase between 2008 and 2014 in the amount of employers providing health insurance for domestic partners (29% to 43%). Lastly, almost all employers (96% of those with 50+ employees) provide 401(k) or 403(b) retirement plans, and 80% of employers make contributions to employees’ individual retirement plans.

While it’s easy to provide reasoning for many of these trend changes (more elder care due to an aging workforce, more domestic partner coverage due to changes in legal and societal perceptions of the LGBT community, more employee assistance programs due to increasingly stressful work environments, etc.) it’s harder to pinpoint the cause of others, like the decrease in leadership programs for women. Could one conclude that that the rising incidences of providing new birth mothers time off has influenced the decrease of leadership development programs for women? Probably not, but it’s interesting to think about, isn’t? This data could support the view that corporate America may be telling women that they’ll support their role as mothers but not their roles as leaders…

Leave a comment

Filed under China Gorman, Data Point Tuesday, SHRM, Workflex

“CEO” or “Female CEO”: Bringing Awareness to “Otherness”

Data Point Tuesday

The Catalyst Research Center recently released the report “Feeling Different: Being the “Other” in U.S. Workplaces” providing interesting data and insight into perceptions of diversity and inclusion in U.S organizations. The study points out the error of common association, which can often cause individuals feelings of “otherness.” This feeling often results from our categorization of groups by their dominant group, i.e. referring to nurses who are male as “male nurses” as opposed to “nurse”, which is commonly associated with the female gender, the position’s majority group. Likewise, male CEO’s are commonly referenced as simply “a CEO” where female CEO’s experience their gender being pointed out: she is “a female CEO.”

Consistently referencing positions based on their dominant group can reinforce the belief that those people holding the position should be from that group, causing those in the minority to feel excluded, divided from the team, and set apart from power structures at the top of their organization. Catalyst’s study points out that gender and race/ethnicity are two of the common bases for feeling like “the other,” but that people of all groups – regardless of whether their racial/ethnic identity reflects that of the majority in society as a whole – can feel different from their workgroup based on race/ethnicity, and that feelings of otherness can really stem from any area of self-identification. For example, besides gender/race/ethnicity, Catalyst’s research also looks at data from LGBT and Expatriate individuals, who often reported experiencing feelings of “otherness.” The study’s findings come from a sample of 2,463 MBA graduates (33% women and 67% men) working in corporate and non-corporate firms in the United States at the time of the survey.

Data from the study highlight some surprising and troubling effects of perceiving oneself as an “other.” Women respondents who identified as feeling racially/ethnically different were the least likely to be at the senior executive/CEO level (10%) compared to men who felt different (19%) and those who did not feel different (16% women; 25% men). It’s important to note, too, that the women who identified as feeling racially/ethnically different had no less experience or qualifications than those in the position. Additionally, Catalyst’s survey identified that women who perceived themselves as “others” experienced fewer promotions: 48.2% had received two or more promotions versus 55.6% of women who did not feel racially/ethically different. 51.4% of men who felt racially/ethnically reported receiving two or more promotions versus 58.4% of men who did not feel racially/ethnically different.

Catalyst’s research also found that people who feel different from the majority in their workgroup are less likely to be mentored by C-suite or senior executives at their organizations. This is troubling considering that previous research by Catalyst found that the level of one’s mentor often predicts advancement (the more senior a mentor the more able they are to recommend for high-level/visibility positions). Of those surveyed, only 58% of women who felt racially/ ethnically different had mentors who were CEOs or Senior Executives. This is compared to 71% of women who did not feel different, 72% of men who did feel different, and 77% of men who did not feel different.

Workplace exclusion or feelings of otherness based on racial/ethnic differences can also affect individuals beyond their organizations. Women who felt racially/ethnically different (46%) were more likely to downsize their dreams and aspirations than women who did not feel different (33%) and of those who felt racially/ethnically different, women were nearly twice as likely as men (25%) to downsize their aspirations. Women who identified as feeling racially/ethnically different and had children and spouses had an even a higher likelihood of downsizing aspirations.

This data provides some serious food for thought for organizations. What is the impact to your organization if talented employees are experiencing feelings of “otherness” and exclusion? Organizations with employees experiencing this are likely missing out on enormous amounts of talent and innovation, not to mention losing important values and aspects of a great workplace culture. Use this research to keep in mind the message we send by identifying roles by the dominant group, and take a look at what policies and programs (both formal and informal) your company has in place to ensure that those with backgrounds that differ from the majority in the workgroup feel that their workplace is an inclusive environment and have equal access to mentorship at the top, fair evaluation, and promotions.

Leave a comment

Filed under Catalyst Research Center, CEOs, China Gorman, Data Point Tuesday, Diversity

I want fair pay, a voice in decision-making and a competent boss. Is that too much to ask?

Data Point Tuesday
In previous posts I’ve discussed data about Millenials’ perceptions and expectations in the workplace, a hugely popular topic, which makes sense considering that this demographic cohort accounts for 77 million workers between the ages of 18 and 35 (according to FORTUNE). Here at Great Place To Work, we’ve recently released a “10 Great Work Places For Millennials List,” accessible on our employer review site Great Rated!, which identifies companies offering the best benefits and perks for this group. When it comes to Millennials, what companies snagged the top spots? Intuitive Research and Technology came in at number one on the list, followed by David Weekly Homes and Allied Wallet. You can check out the full list here for the full 10 company rankings and culture reviews.

The research conducted for this list of workplaces that stand out as exceptional for Millennial employees is highlighted, but also identified are the sorts of practices and programs that move the needle for these employees. When looking at workplace culture features that differed most between the top 10 Great Workplaces for Millennials and the 10 least-great Workplaces for Millennials, a few areas stood out. Survey data revealed “fair pay” as a very important feature of great workplaces for Millennials. There was a 37 percentage point difference between the top 10 companies for Millennials and bottom 10 companies based on responses to the statement, “I feel I receive a fair share of the profits made by this organization.” Millennials also place a high value on having a say in decisions at their organization. Our study recorded a 28 percentage point difference between the top 10 and bottom 10 companies on “Management involves people in decisions that affect their jobs or work environment.” Additionally, competent management is a highly valued feature for Millennials, with a 26-percentage point difference on “Management does a good job of assigning and coordinating people.”

The analysis also highlighted some surprising workplace features that don’t move the needle much for Millennials. One such feature is interesting considering it’s been such a hot-topic: work-life balance. There was just a 10-percentage point difference between the top 10 workplaces for Millennials and the bottom 10 on the question: “I am able to take time off from work when I think it’s necessary.” This statement was one of the 10 with the least amount of difference among all 58 survey statements. The response calls into question the attention that has been placed on Millennials’ desire for work-life balance. Has this dynamic been overblown? It’s possible, but perhaps it’s more likely that many employers have considerably improved programs and policies that promote work-life balance, making it a mute point for Millennial respondents.

Another two surprising work-place dynamics that were not greatly distinguishable between the top 10 workplaces for Millennials and bottom 10 workplaces were self-expression (with just a 10 percentage point difference on the statement: “I can be myself around here”) and friendly, welcoming workplaces (with an 8 percentage point difference on the statement “When you join the company, you are made to feel welcome”). Again, these percentages beg the question of whether the importance Millennials place on such dynamics has been hyped up, and are not necessarily an accurate reflection of Millennial expectations. Considering the top features that Millennials did identify as highly important though (fair pay, say in decisions, and competent management) it seems more likely that these aren’t necessarily features that Millennials don’t value, but features that companies have greatly improved versus features that are often problematic for companies.

Do these trends accurately reflect the workplace programs that are important to your Millennial employees?

2 Comments

Filed under China Gorman, Data Point Tuesday, FORTUNE Magazine, Great Place to Work, Great Place to Work Institute, Great Rated!, Millennials

Trust Is In Short Supply – All Over the World!

Data Point Tuesday

The recently released 2014 Edelman Trust Barometer, highlights a degradation of trust between people and the institution of government, recording the biggest gap in trust since the study began in 2001. Edelman attributes this gap to “a continued destruction of trust in government that began in 2011, and a steady rise in belief in business since its nadir in 2008.” In almost half of the 27 countries surveyed, Edelman recorded a gap of 20+ points, with some countries reporting a divide of nearly 40 points. This means that people trust business more than they trust their government. The study is the firm’s 14th annual trust and credibility survey; it sampled 27,000 general population respondents with an over- sample of 6,000 informed publics ages 25-64 across 27 countries.

Globally, and overall, trust declined over the last year. Edelman cites the reason for this decline due largely in part to falling trust of government in many countries. Poland, the United States, and Mexico experienced the most major trust declines (-13, -10, and -9 points), while the biggest increases in trust occurred in UAE, Indonesia, Australia and Argentina (+13, +10, +8, +8 points). General public populations reported substantially lower trust levels than informed publics, with a global trust difference of 9 points. Government saw the largest decline in trust of any institution in 2014, with the largest drops in trust in government seen in the U.S., France and Hong Kong (16, 17 and 18 points). Media also saw a decline in 2014, with nearly 80 percent of countries reporting trusting media less over the last year.

Edelmam Graphic 1Edelman’s Trust Barometer reports that trust in business has achieved an amount of stability since the implosion of trust in 2008 and 2009. With trust in business leveling out, and trust in government declining, comes the historic gap of 14 points globally between trust in business and trust in government. Despite this decline in trust of government though, the survey reports a strong demand for government regulation of business to protect consumers, with over 50% of respondents viewing government protection of consumers from business as important. The majority of respondents did not, however, see government as capable of delivering the necessary regulations on its own. 79% of respondents agreed: “when policymakers are developing new regulations on businesses and industries, they should consult with multiple stakeholders (i.e. NGOs, academics, the affected businesses/industries, etc.) before making final decisions.” As the survey states, this indicates “a significant level of permission for business to play a role in the debate and design of regulation”.

Edelman Graphic 2When it comes to trust in specific industries, technology leads the front with a trust level of 79% among informed publics. Media companies and banks trail when it comes to trust, seeing little improvement since 2009. The top five countries with the highest levels of trust in markets were (in order): Germany, Sweden, Switzerland, Canada and the U.K.. BRIC countries recorded the lowest levels of market trust. When Edelman asked respondents to rank levels of trust based on business ownership structure, family-owned and small- & medium-sized business outperformed big business in all regions but Asia, where publicly-traded and big business companies received higher trust levels. A major concern however, is the plateauing and distrust in leadership that the Trust Barometer records. Academics and experts (67 percent), technical experts (66 percent) and “a person like yourself” (62 percent) are the most trusted sources of information about companies (trust in “a person like yourself” increased significantly since 2009). CEOs and government leaders however, remain at the bottom of the list for both informed and general publics, with extremely low levels of trust.

Edelman Graphic 3Though concerning and perhaps daunting, this speaks clearly to an opportunity that leadership has to engage and communicate transparently – an opportunity to begin to regain a credible voice and change perceptions. For leaders of companies, trust in them is explicably linked with the trust in the company, and the influence they wield because of that cannot be ignored. The Edelman Trust Barometer identified specific actions CEOs can take to build trust, and each actions level of importance to the general public. The highest-ranking actions included: communicating clearly and transparently (82%), telling the truth regardless of how complex or unpopular it is (81%) and engaging with employees regularly (80%). Other high-ranking actions include being visible during challenging times, and having an active media presence. Though the low levels of trust in business leadership seem to indicate it’s a complex thing to build, respondents indicate it’s simply about going back to basics. Engage, support, and don’t forget that important rule folks, honesty is the best policy!

Leave a comment

Filed under China Gorman, Data Point Tuesday, Edelman Trust Barometer, Leadership, Trust

Promoting from Within: Not as Easy as it Seems

Data Point Tuesday
A recent survey by the College for America, “The 2014 Workplace Strategies Survey”, conducted by Greenberg Quinlan Rosner Research, reveals that employers prefer developing employees to hiring new ones by a 2:1 margin. A smart and cost-effective talent management strategy to be sure. But preferring to promote and being able to promote are two quite different things – as this study points out.

73% of survey respondents stated that for low-level team leader positions and middle management roles, developing current employees’ skills (vs. hiring new) best reflected their company’s talent strategies. For senior management and executive roles, 67% of respondents reported that developing the skills of current employees (vs. hiring new) best reflected their company’s talent strategies. The results are clear, companies want to promote from within! The College of America’s survey sourced information from 400 senior business leaders responsible for HR and/or administration at companies of 500+ employees, between December 6th and 16th 2013.

College for America
Though these employers prefer promotion to new hiring, the data show that developing leadership skills and addressing skill gaps remain significant issues to overcome. When asked about the challenges faced when developing employees, 94% of respondents reported that the need to build talent and leadership was a very or somewhat important challenge; 87% reported that employees missing skills for promotion was a very or somewhat important challenge; and 85% reported that finding well qualified candidates was a very or somewhat important challenge. The survey also shows that companies with 50% or more full time employees were hit harder by the skills gap than companies with 50% of more part time employees. “Heavily full-time” organizations reported that the three biggest challenges their organizations faced were: talent and leadership, qualified applicants, and employees having the right skills for promotion. Companies with 50% or more part time employees reported their top three challenges as: talent and leadership, retaining workers, and having sufficiently engaged employees.

The good news though, is that many organizations are instituting employee development programs, and a high percentage of organizations are offering tuition reimbursement. The College for America’s survey reports that 76% of organizations offer tuition reimbursement to employees to help them pursue a college degree. With this, 79% of organizations report that tuition reimbursement is available to the majority of employees (executives, senior level managers, supervisors and middle managers, and workers without a college degree). So the beginning step of making degree programs affordable for workers of all levels is being offered by a majority of employers. The next steps of supporting degree completion and further supporting internal mobility are next if employers will truly be able to meet their strategic plan to promote from within rather than buying new talent in the open market.

1 Comment

Filed under China Gorman, College for America, Data Point Tuesday, Employee Development Program, Hiring, Workforce Skills, Workplace Strategies